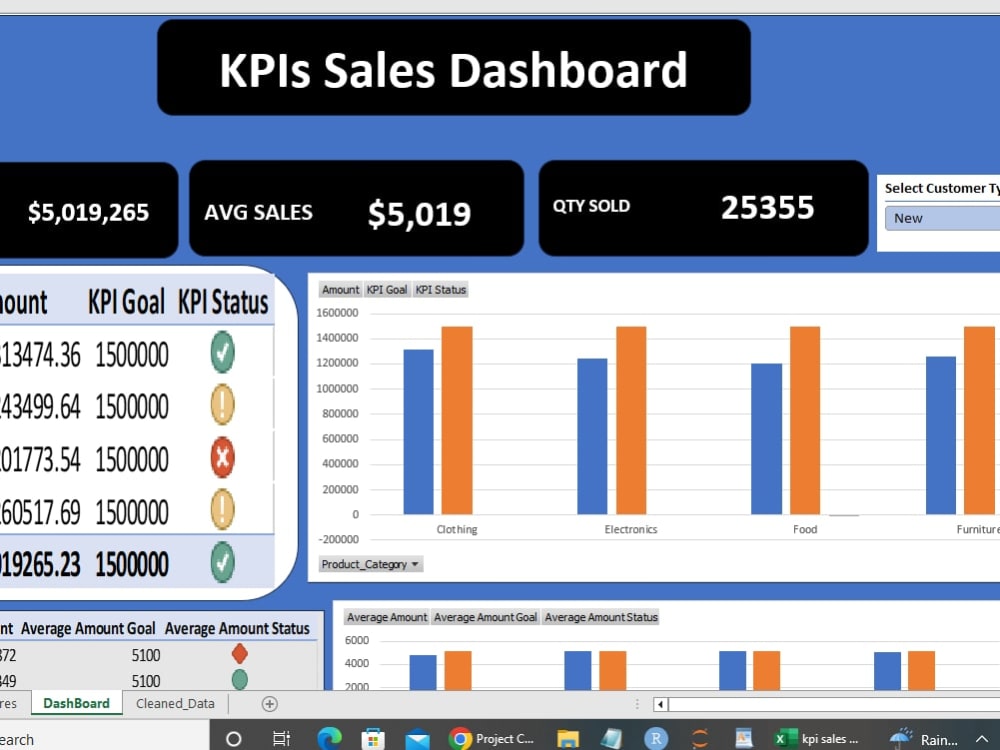
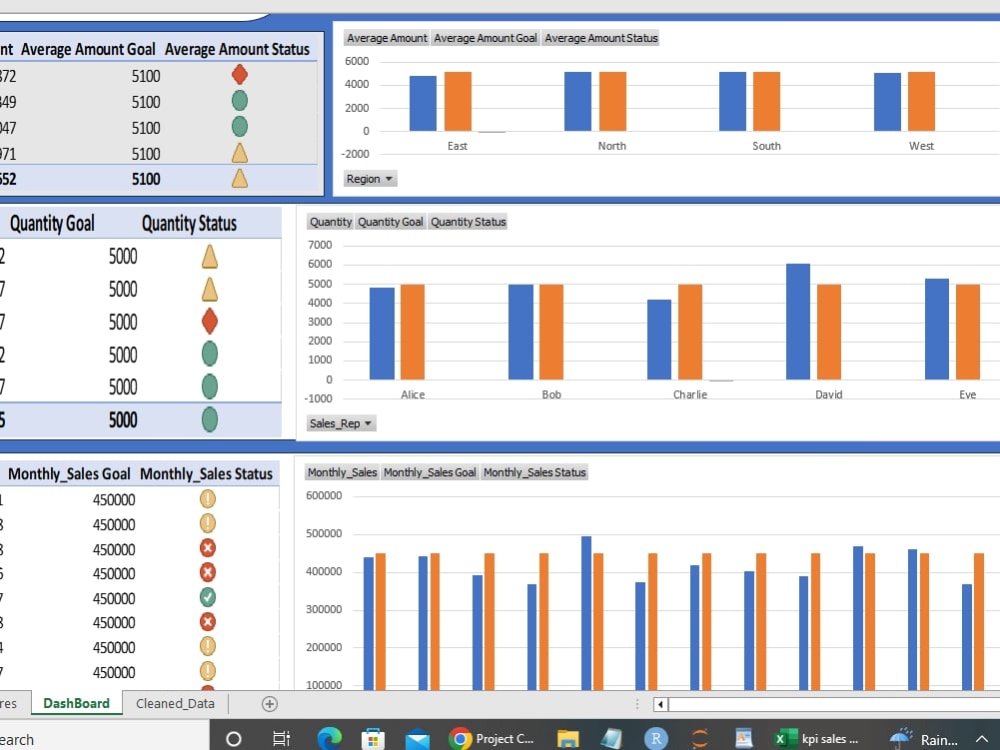
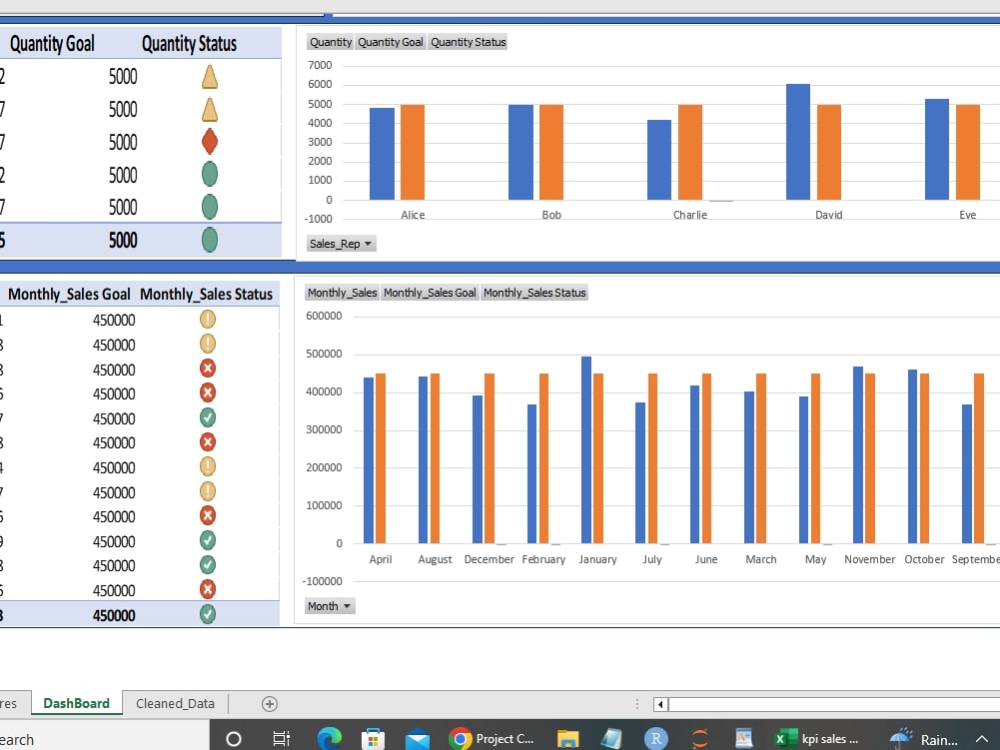
You will get KPIs Tracking in Excel
Project details
Development and tracking KPIs with Excel. I develop and track KPIs with excel and deliver it well polished. This helps to track business goals .
Data Tool
Microsoft ExcelWhat's included
| Service Tiers |
Starter
$5
|
Standard
$15
|
Advanced
$30
|
|---|---|---|---|
| Delivery Time | 1 day | 1 day | 1 day |
Number of Revisions | 1 | 1 | 1 |
Number of Pages Mined/Scraped | 1 | 5 | 3 |
Number of Sources Mined/Scraped | 1 | 0 | 0 |
Optional add-ons
You can add these on the next page.
Additional Revision
+$5
Additional Page Mined/Scraped
(+ 1 Day)
+$5About James
Data analyst/data science, SQL, Excel
Enugu, Nigeria - 5:19 pm local time
About Me
I’m James Kingsley Philip, a results-driven Data Scientist with 3+ years of hands-on experience turning raw data into powerful business insights and predictive solutions. My expertise spans Python, SQL, Excel, Power BI, Tableau, Statistical Analysis, and advanced Machine Learning.
I’ve successfully delivered end-to-end data projects for businesses across multiple industries, including:
Fraud Detection Systems (Banking & Fintech)
Predictive Healthcare Models (Heart Disease Prediction, Time Series Forecasting)
Fake News Detection Platforms
Product Recommendation Engines
Customer Churn Analysis Dashboards
Sales Forecasting & Regression Analysis for strategic planning
What I Do Best:
✅ Data Cleaning & Preprocessing – transforming messy data into high-quality, analysis-ready datasets
✅ Exploratory Data Analysis (EDA) – uncovering hidden trends and actionable insights
✅ Statistical Analysis – hypothesis testing, correlation analysis, ANOVA, A/B testing
✅ Time Series Analysis & Forecasting – ARIMA, SARIMA, Prophet, seasonal trend analysis
✅ Regression Analysis – linear, logistic, ridge, lasso, and multiple regression modeling
✅ Machine Learning & AI – classification, clustering, anomaly detection, NLP, deep learning
✅ MLOps & Deployment – FastAPI, Streamlit, MLflow, CI/CD pipelines, AWS, GCP
✅ Data Visualization & Reporting – building interactive dashboards and business reports
Tech Stack:
Languages: Python, SQL, R
Data Analysis: Excel Google Sheet
Translation
Transcription
Libraries & Frameworks: Pandas, NumPy, Scikit-learn, TensorFlow, PyTorch, spaCy, VADER, Statsmodels, Prophet
Visualization: Power BI, Tableau, Plotly, Matplotlib, Seaborn
MLOps & Deployment: FastAPI, Streamlit, MLflow, Docker, CI/CD, AWS, GCP
Databases: PostgreSQL, MySQL, SQLite
Steps for completing your project
After purchasing the project, send requirements so James can start the project.
Delivery time starts when James receives requirements from you.
James works on your project following the steps below.
Revisions may occur after the delivery date.
Tracking Your KPI
I develop and track KPIs