You will get Customer Retention & Churn Prediction (Python, ML-Powered)
Project details
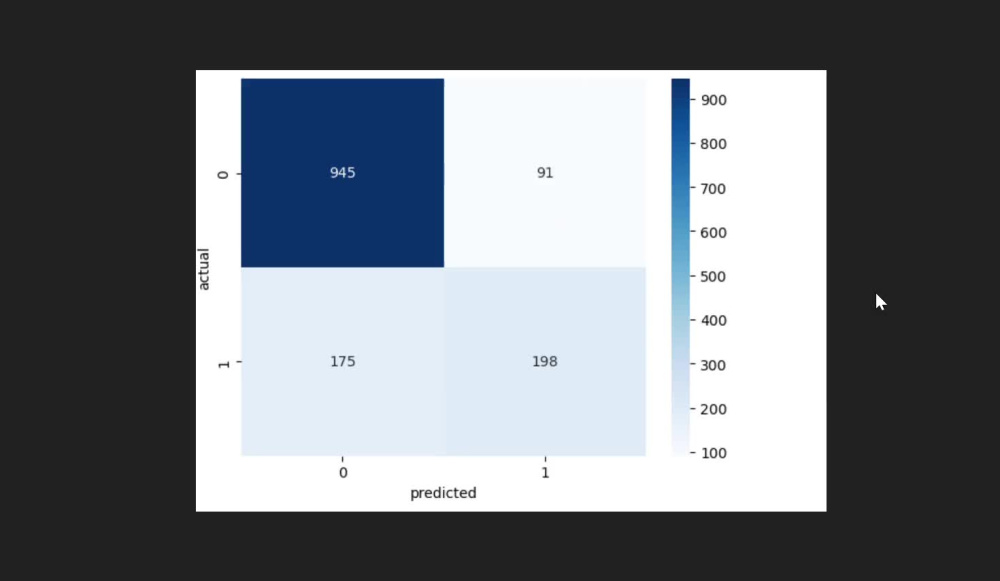
Stop the revenue leak. I provide a professional Machine Learning solution to predict customer churn and identify exactly why your clients are leaving. I don't just deliver code; I deliver a Retention Roadmap based on a custom-tuned Gradient Boosting Classifier that achieved 81.1% accuracy in my latest model.
What sets this project apart? Most analysts only look at who left. I perform a Multivariate Discovery Phase to find hidden "Friction Points." Using Python forensics, I’ve identified trends like the "2-Year Retention Wall," where veteran customers churn regardless of price, and "Price-Neutrality," proving if churn is driven by fees or service quality.
What you receive:
81.1% Accuracy Engine: I benchmark 5 algorithms (GBC, Random Forest, LogReg, KNN, SVC) to find your data’s "Winner."
Data Integrity: Professional preprocessing using IQR Outlier Detection and Label Encoding for mathematically sound results.
Feature Correlation Mapping: I pinpoint exactly which services (like Tech Support) are the strongest anchors for your customer loyalty.
Deliverables: A well-documented Jupyter Notebook, trained model files, and clear strategy visualizations.
Machine Learning Tools
pandas, Python, Python Scikit-Learn, XGBoostWhat's included
| Service Tiers |
Starter
$150
|
Standard
$285
|
Advanced
$450
|
|---|---|---|---|
| Delivery Time | 3 days | 5 days | 7 days |
Number of Revisions | 1 | 2 | 3 |
Number of Model Variations | 1 | 3 | 5 |
Number of Scenarios | 1 | 2 | 3 |
Number of Graphs/Charts | 3 | 6 | 10 |
Model Validation/Testing | - | - | - |
Model Documentation | - | - | - |
Data Source Connectivity | - | - | - |
Source Code | - | - | - |
Frequently asked questions
About Adams
BI Analyst | Revenue & Sales Dashboards | Power BI, SQL, Python
Riyadh, Saudi Arabia - 6:47 pm local time
Most teams have data but struggle to answer simple questions: What’s driving performance? Where are we losing money or people? What should we focus on next?
I solve this by combining Business Intelligence with strong data preparation and analytics, delivering dashboards that support real decisions, not just visuals.
What I do best
✔ Power BI & Tableau Dashboards – Executive-ready dashboards for sales, finance, operations, and HR
✔ KPI & Performance Tracking – Clear metrics aligned with business goals
✔ Data Cleaning & Modeling – SQL, Power Query, and Python to transform raw data into reliable datasets
✔ Accurate Calculations – Trusted DAX (Power BI) and Tableau calculations with consistent numbers
✔ Report Automation – Replace manual spreadsheets with live, refreshable dashboards
What you’ll get
• Decision-ready dashboards built for clarity and usability
• Reliable numbers you can trust
• Drill-down insights to understand trends and gaps
• Clear communication, fast delivery, and revisions
Tools
Power BI, Tableau, SQL, Python (Pandas), DAX, Power Query, Excel
If you need dashboards or analytics that actually support decisions, I’m ready to help.
Let’s build a solution that makes your data useful.
Steps for completing your project
After purchasing the project, send requirements so Adams can start the project.
Delivery time starts when Adams receives requirements from you.
Adams works on your project following the steps below.
Revisions may occur after the delivery date.
Data Forensic Audit & Preprocessing
I perform a deep-clean of your dataset using Python. This includes handling missing values, encoding categorical variables, and using IQR (Interquartile Range) logic to remove outliers that could skew your business insights.
Multivariate Trend Discovery
I generate high-level visualizations, including Correlation Heatmaps and Subplots. This is where I identify "Hidden Risk Windows"—such as the 2-Year Wall—to see exactly when your customers start losing interest.