You will get Microsoft Excel Dashboard | Data Visualization | Customized Template
Top Rated
Project details
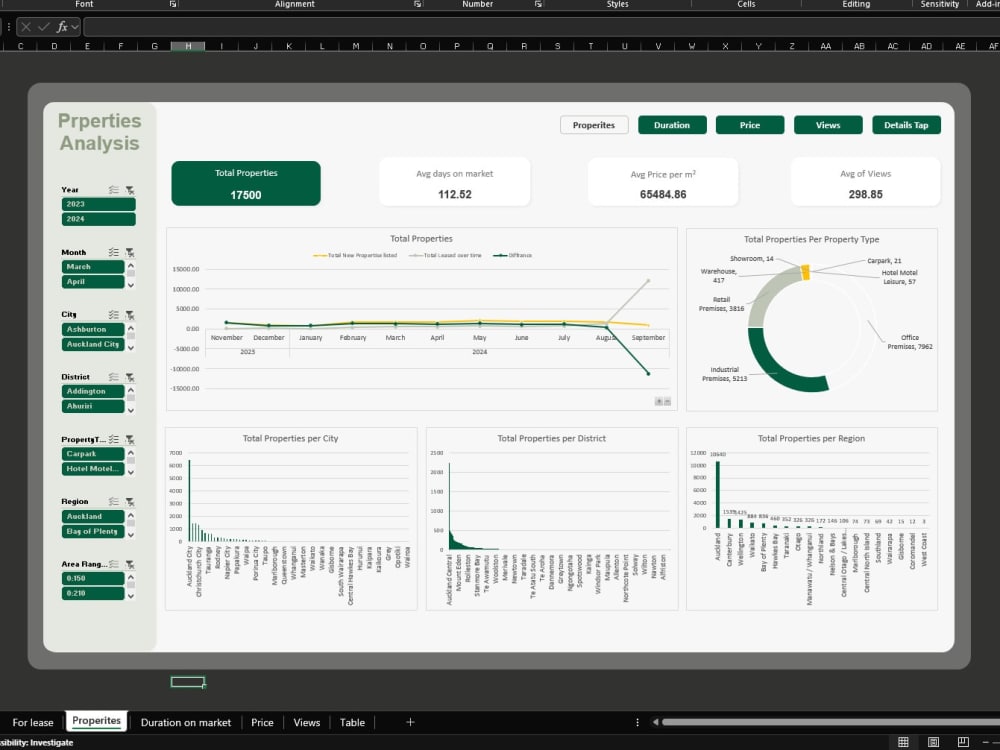
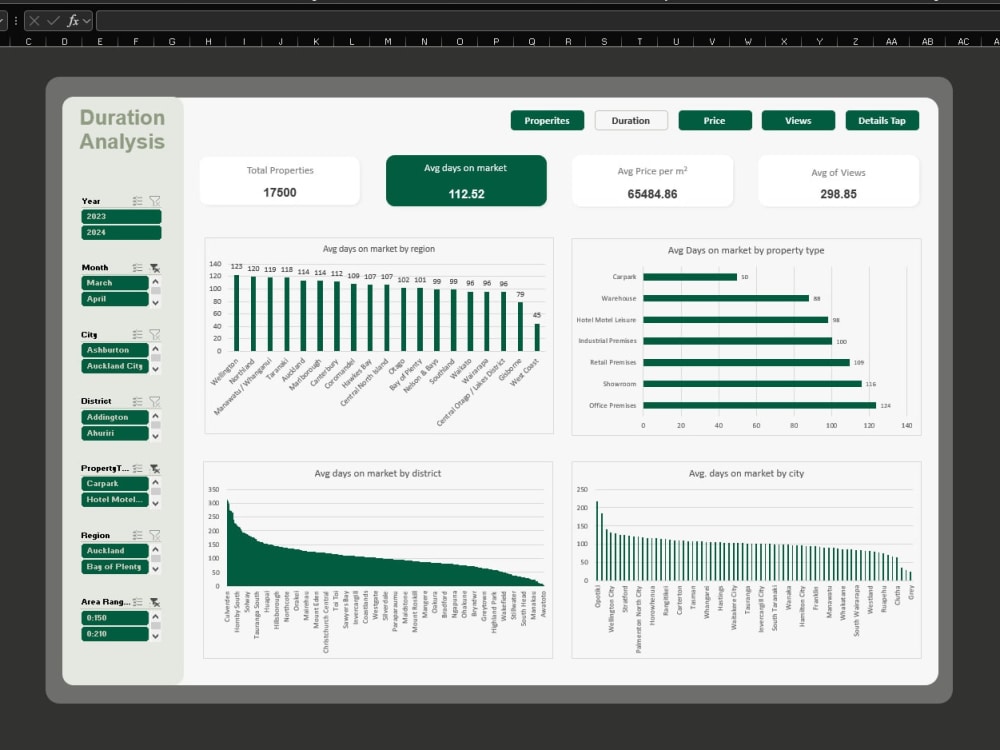
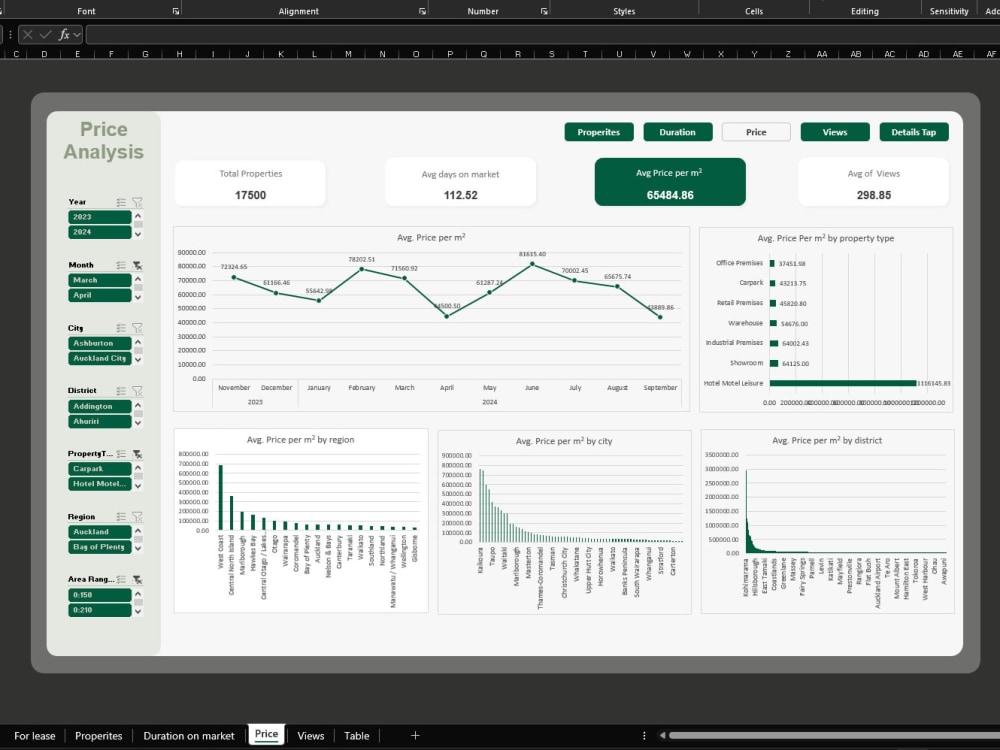
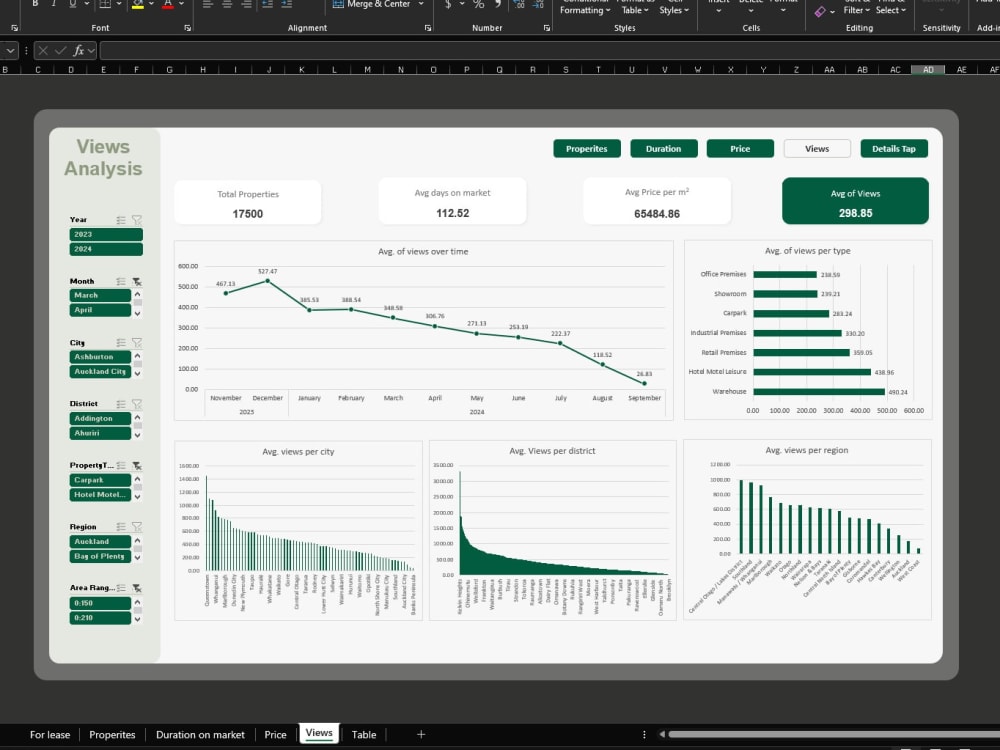
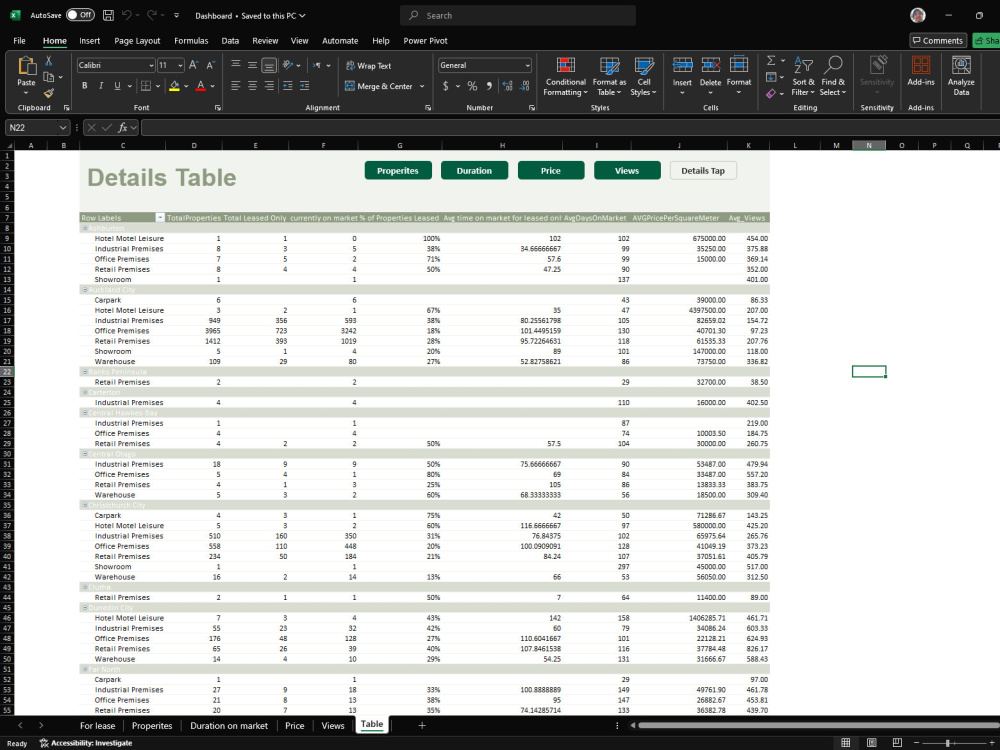
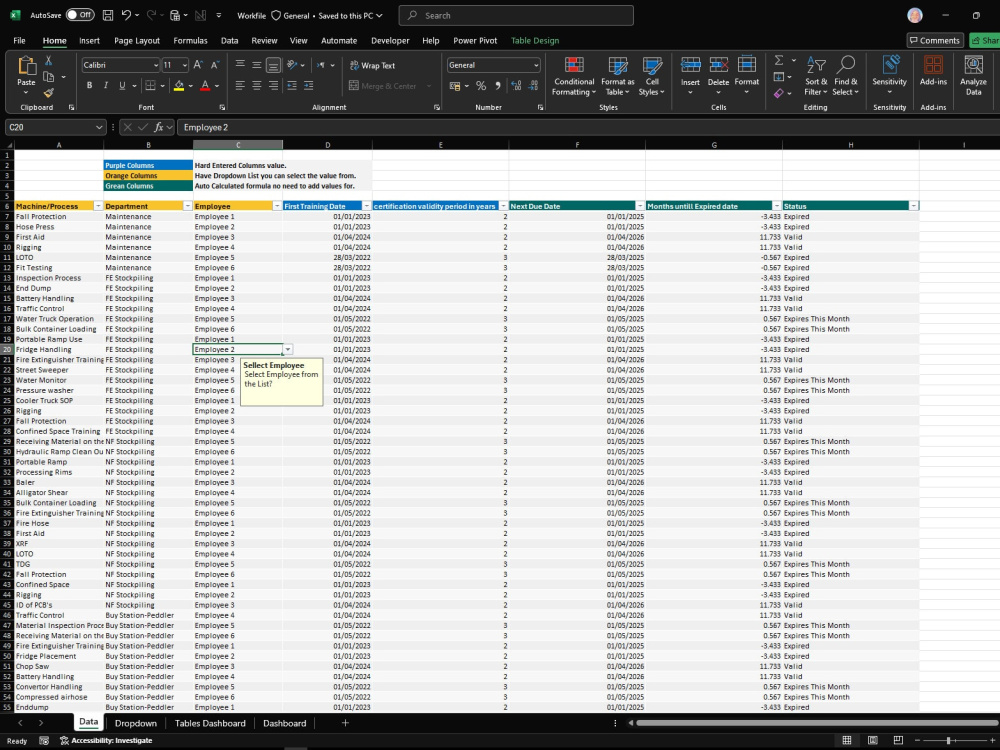
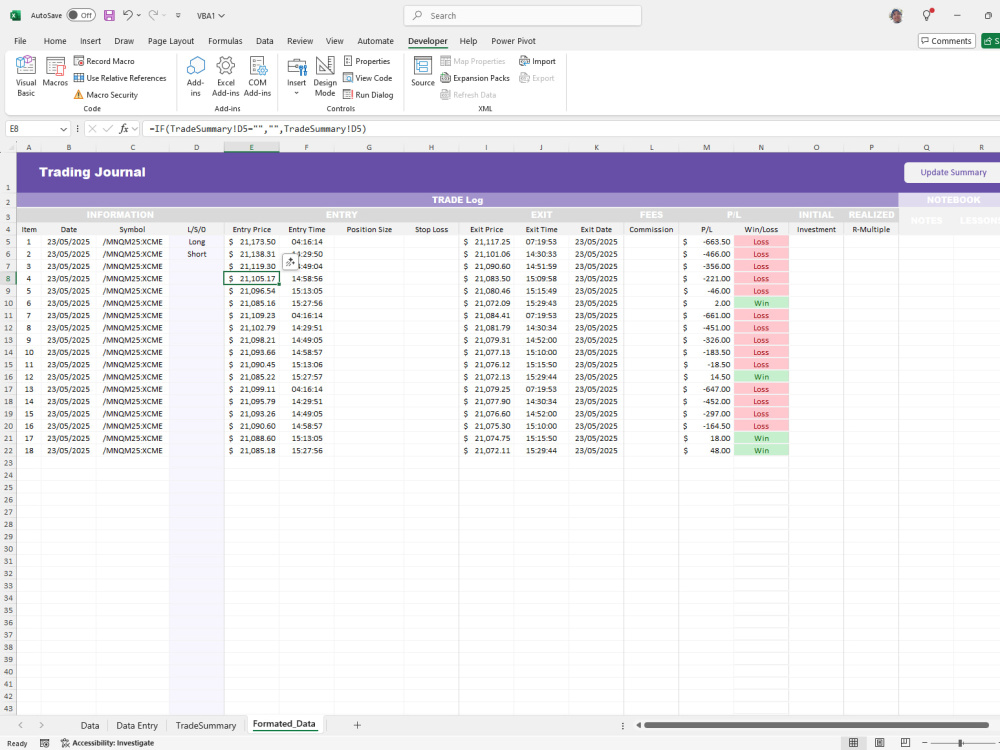
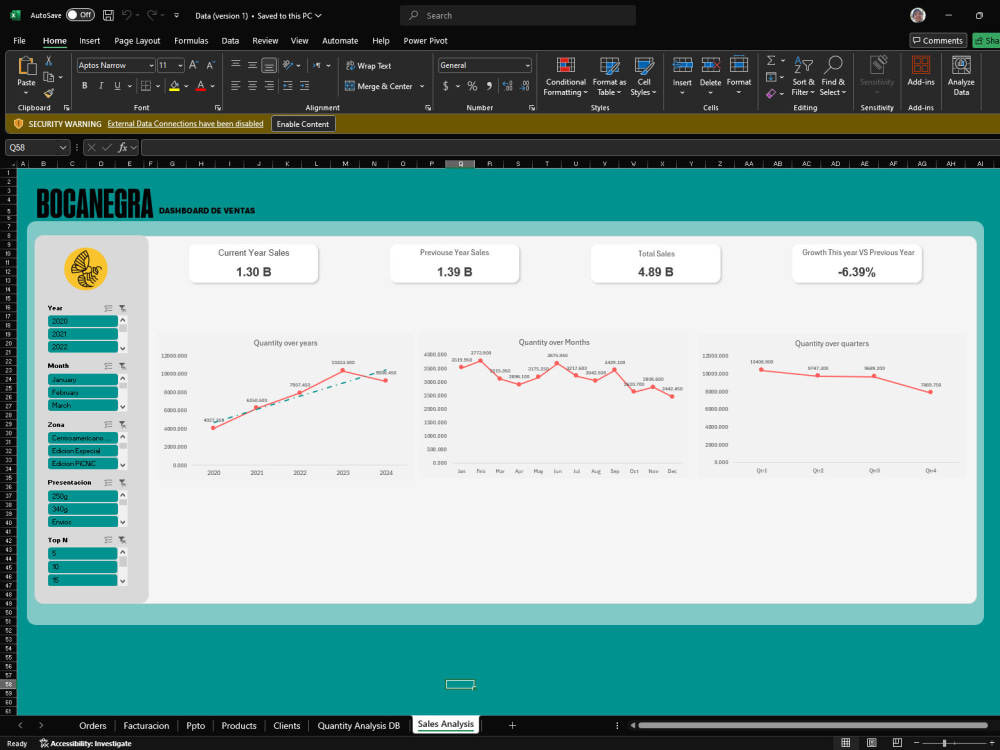
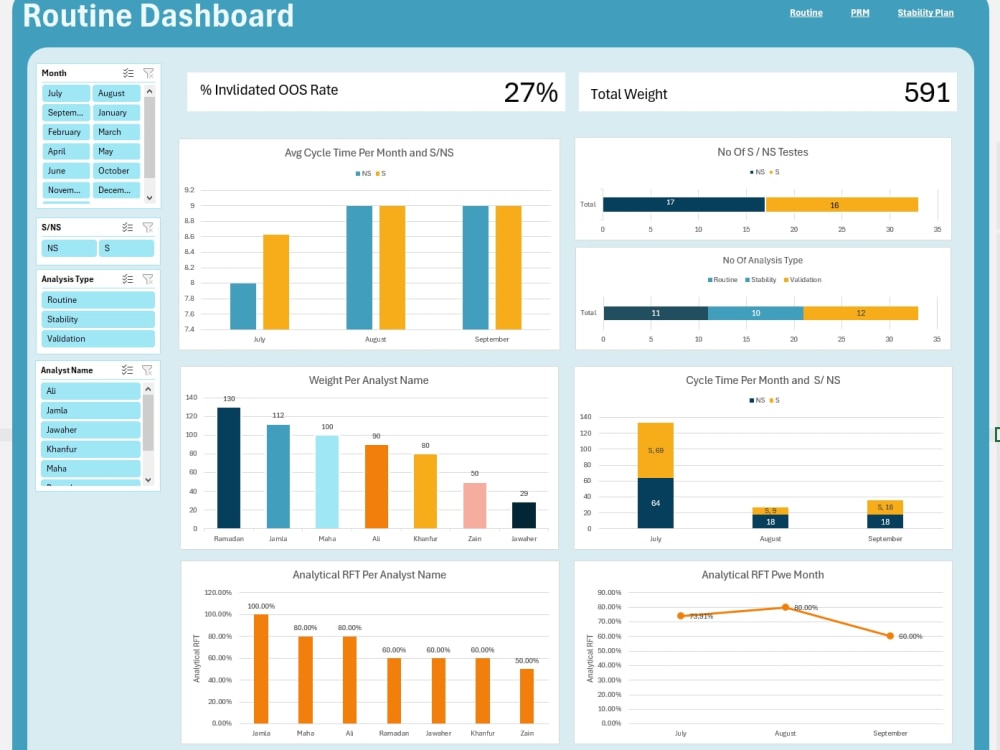
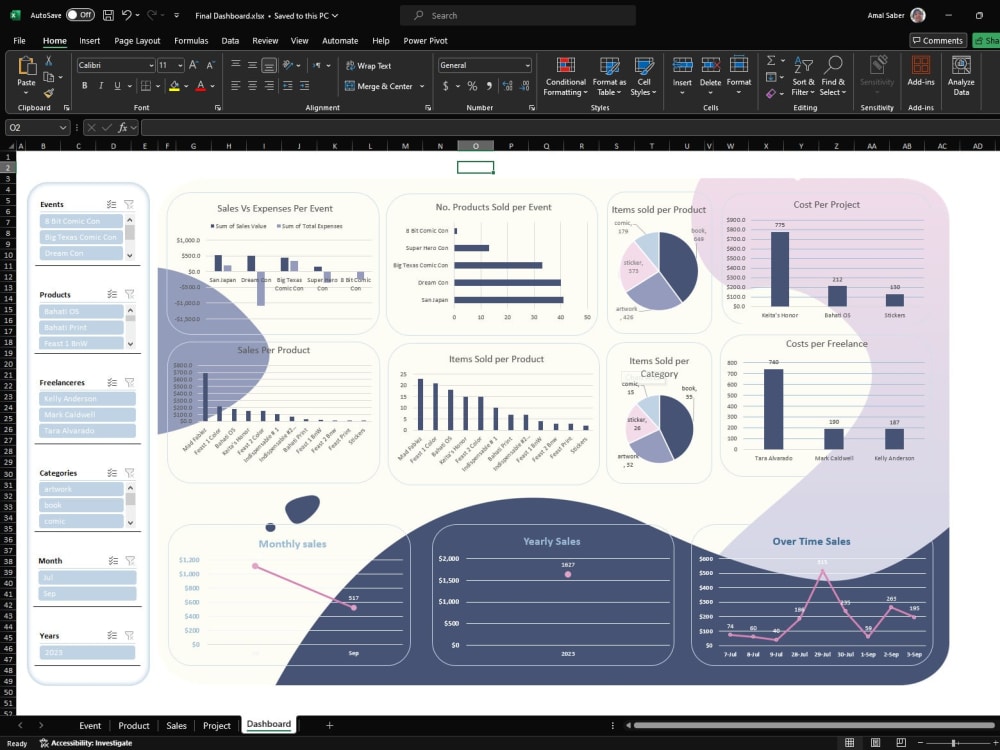
I design custom Excel templates and interactive dashboards that help you clearly track, analyze, and understand your business performance.
Your dashboard will be:
• Easy to use and understand, even for non-technical users
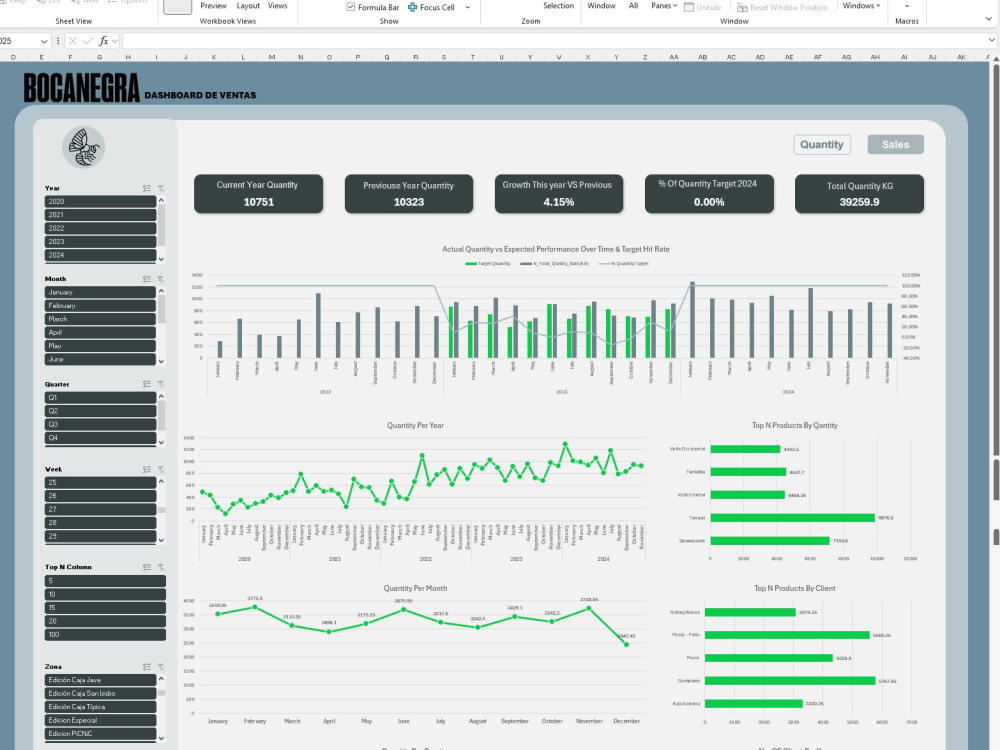
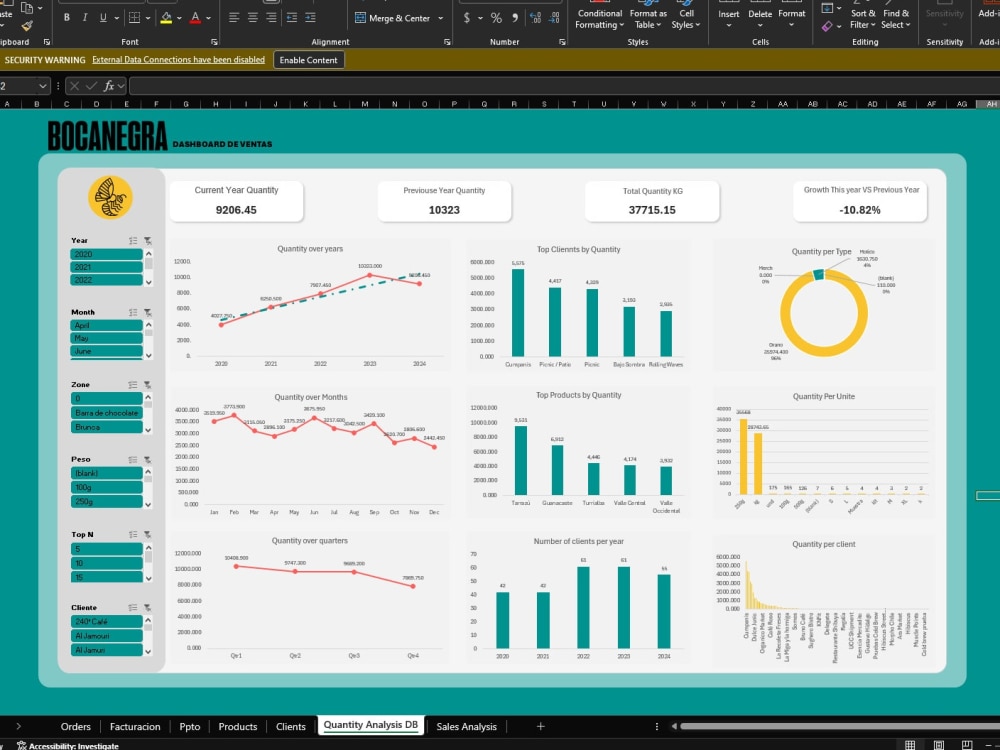
• Insightful and data-driven, delivering strong analysis, statistics, and meaningful KPIs
• Visually appealing, following modern UI/UX best practices for clarity and smooth navigation
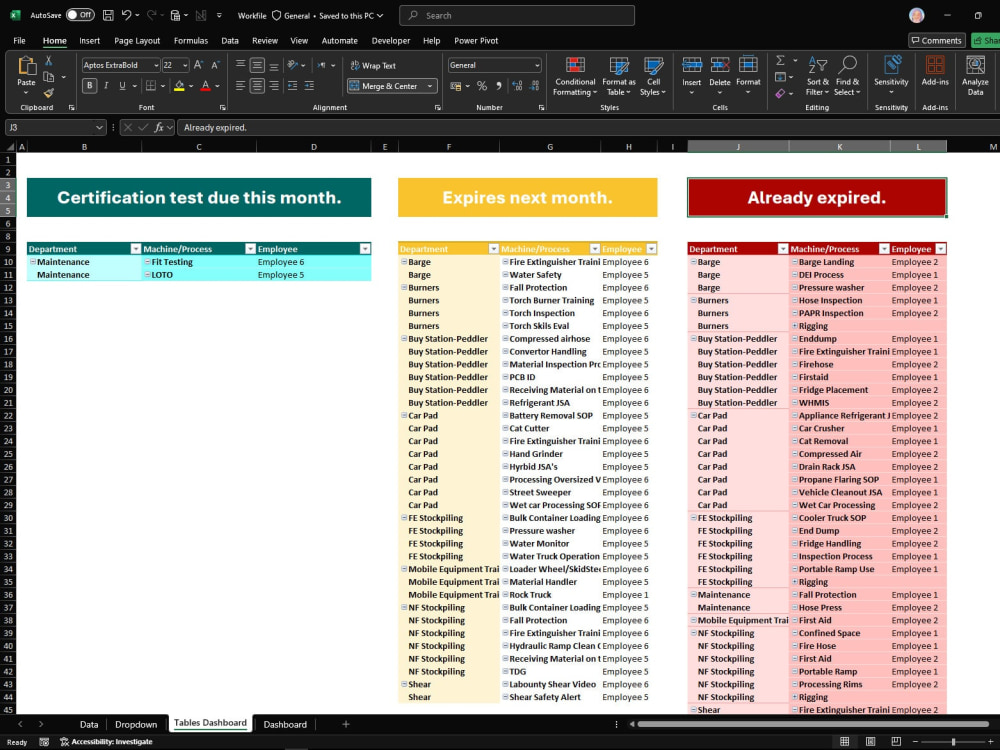
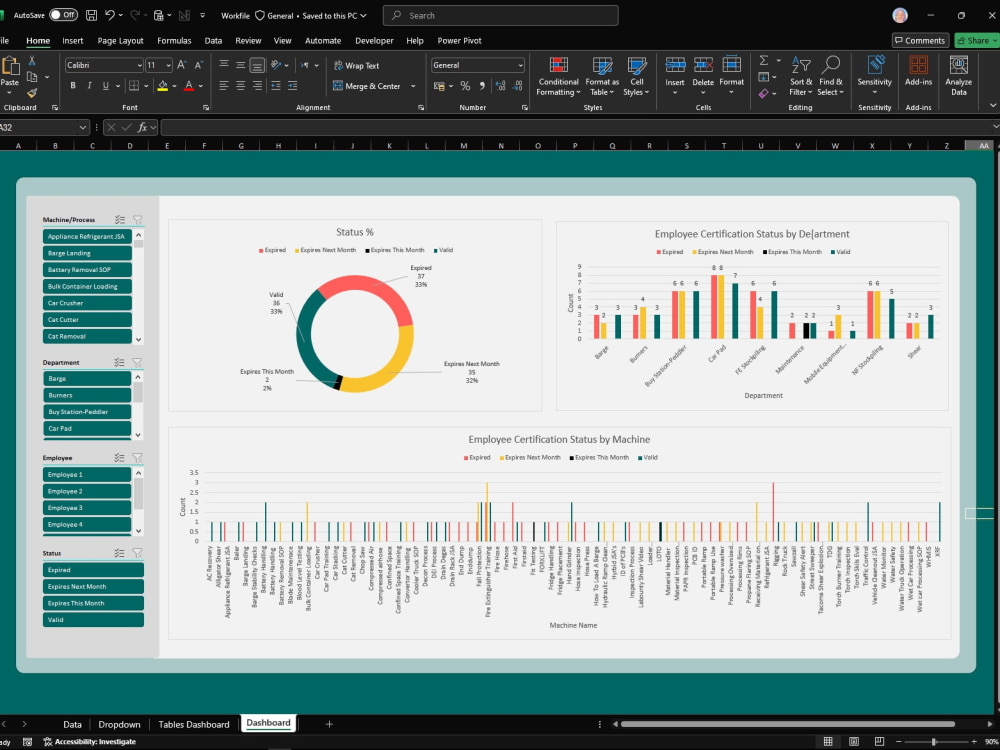
• Highly interactive, using filters, buttons, slicers, and dynamic elements for full control
I focus on more than just functionality. I create dashboards that are:
✔ Accurate
✔ Clean and well-structured
✔ Easy to navigate
✔ Professional and client-ready
If you’re looking for a complete dashboard solution from every angle — design, usability, and deep analysis, I’m the right person for the job.
📩 Let’s connect and start building your dashboard today.
Your dashboard will be:
• Easy to use and understand, even for non-technical users
• Insightful and data-driven, delivering strong analysis, statistics, and meaningful KPIs
• Visually appealing, following modern UI/UX best practices for clarity and smooth navigation
• Highly interactive, using filters, buttons, slicers, and dynamic elements for full control
I focus on more than just functionality. I create dashboards that are:
✔ Accurate
✔ Clean and well-structured
✔ Easy to navigate
✔ Professional and client-ready
If you’re looking for a complete dashboard solution from every angle — design, usability, and deep analysis, I’m the right person for the job.
📩 Let’s connect and start building your dashboard today.
Data Tool
Microsoft ExcelWhat's included
| Service Tiers |
Starter
$70
|
Standard
$150
|
Advanced
$300
|
|---|---|---|---|
| Delivery Time | 5 days | 7 days | 15 days |
Number of Revisions | 1 | 2 | Unlimited |
Number of Graphs/Charts | 10 | 25 | 60 |
Data Source Connectivity | |||
Web Embedding | - | - | - |
Interactive/Animated Visuals |
Optional add-ons
You can add these on the next page.
Fast Delivery
+$10 - $50
49 reviews
(48)
(1)
(0)
(0)
(0)
This project doesn't have any reviews.
AM
Anita M.
May 22, 2026
Interactive Power BI Dashboard for Marketing Performance
MP
Manisha P.
Apr 22, 2026
Data Analyze - Unused Pay Grades
AP
Aja P.
Apr 6, 2026
Excel Data Analysis and Pivot Table Creation
IC
Israel C.
Mar 31, 2026
Excel Assignment
Amal did an excellent job on my project. She was quick, communicative, and delivered high-quality work. Everything was completed accurately and on time, and she made the whole process smooth and stress-free. I would definitely recommend her and look forward to working with her again.
MP
Manisha P.
Mar 31, 2026
Pay Grades file Audit
About Amal
Data Analyst | Data Visualization | Dashboards | Power BI | Excel
98%
Job Success
Manfalut, Egypt - 12:48 pm local time
Do you seek to transform your data into clear, insightful visualizations?
Are you eager to uncover valuable insights buried within your datasets?
Or perhaps you need customized Excel or Google Sheets templates and calculations?
I'm here to help. With over 2 years of dedicated experience in analysis, visualization, statistics, and UI/UX, I'm here to address these needs and more.
I'll maximize data Impact to help find solutions and make confident decisions based on facts, not perceptions.
✨My Approach:
Understand the problem and requirement: communicate with you, ask a few questions and have answers, also investigate the data then identify the best solution based on your case, need, and data, The last thing in this stage planning for the implementation.
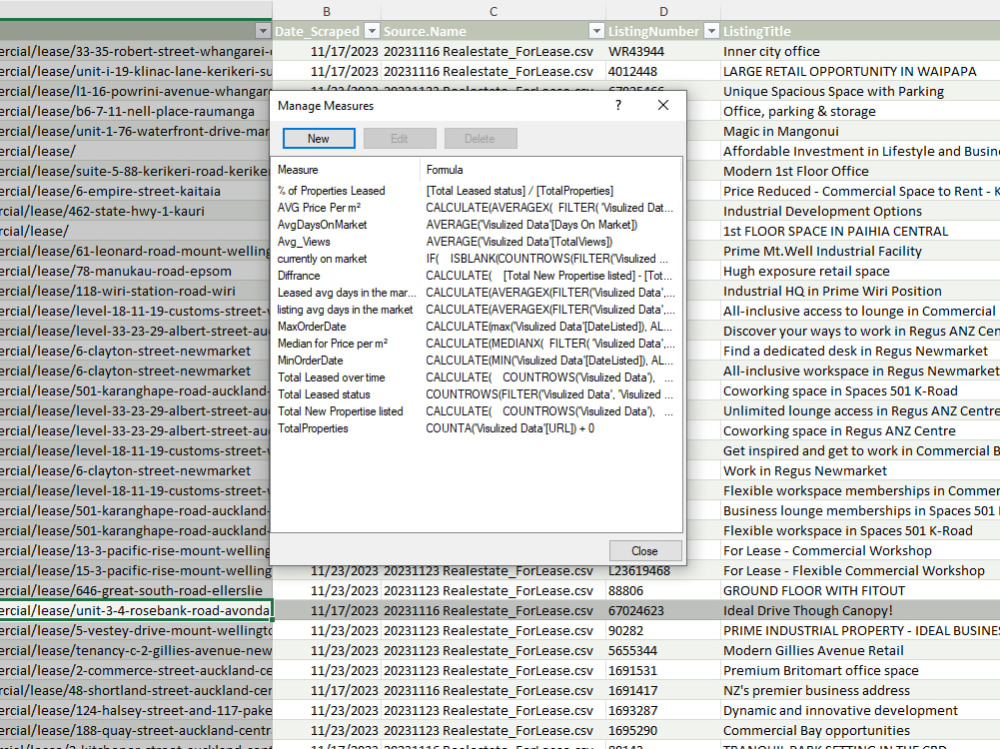
High-quality data & Accurate Data Models: after investigating the data and identifying its problems it's time to load it to Power BI from any data source, start the cleaning process using Power Query and Dax also create accurate data models by connecting the tables to the right ways for fast, accurate execution.
Informative, visually appealing, Clean, and interactive dashboards: choose the perfect chart for every unique data type, group charts under titled sections or pages. Add interactivity components like filters, slicers, and buttons, choose consistent color themes, and contrast, and consider Mind Color Psychology that indicates data and insights.
🎯 Results you can expect when you hire me:
Insights and visualizations that are sharp and precise, give your business the advantage it needs to lead the way.
🤝 𝗪𝗛𝗔𝗧'𝗦 𝗧𝗛𝗘 𝗡𝗘𝗫𝗧 𝗦𝗧𝗘𝗣?
Ready to make your project a success? Contact me today, and let's make it happen!
Steps for completing your project
After purchasing the project, send requirements so Amal can start the project.
Delivery time starts when Amal receives requirements from you.
Amal works on your project following the steps below.
Revisions may occur after the delivery date.
Understand Your Needs Review your data, business goals, and requirements.
Review your data, business goals, and requirements.
Plan the Dashboard
Outline structure, key metrics, and visuals to include based on our needs.