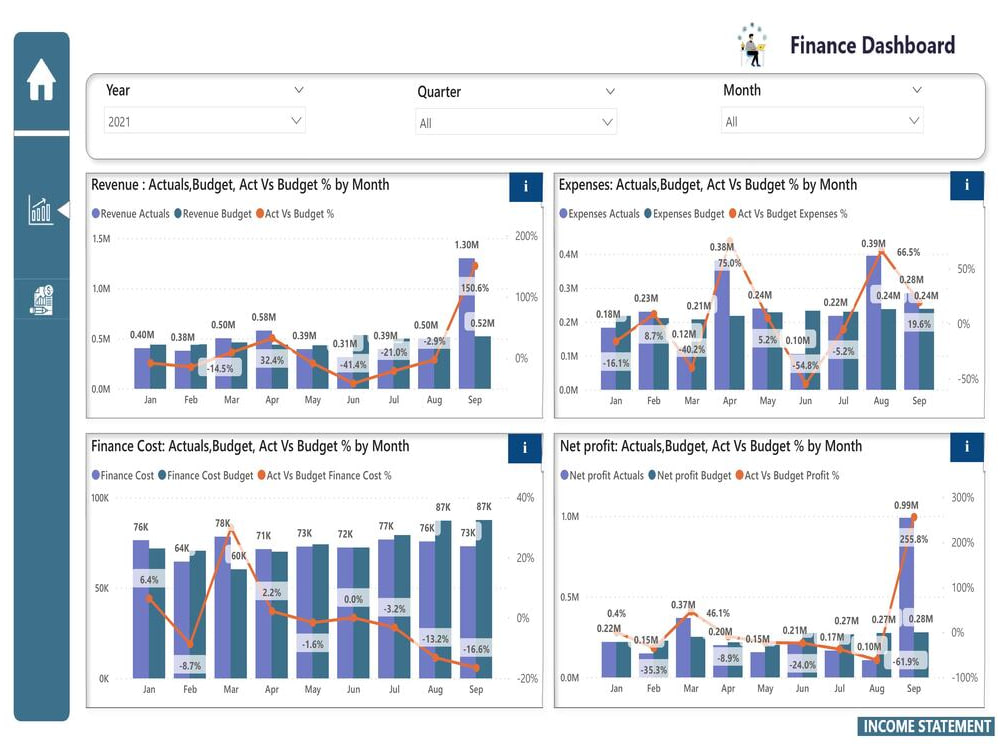
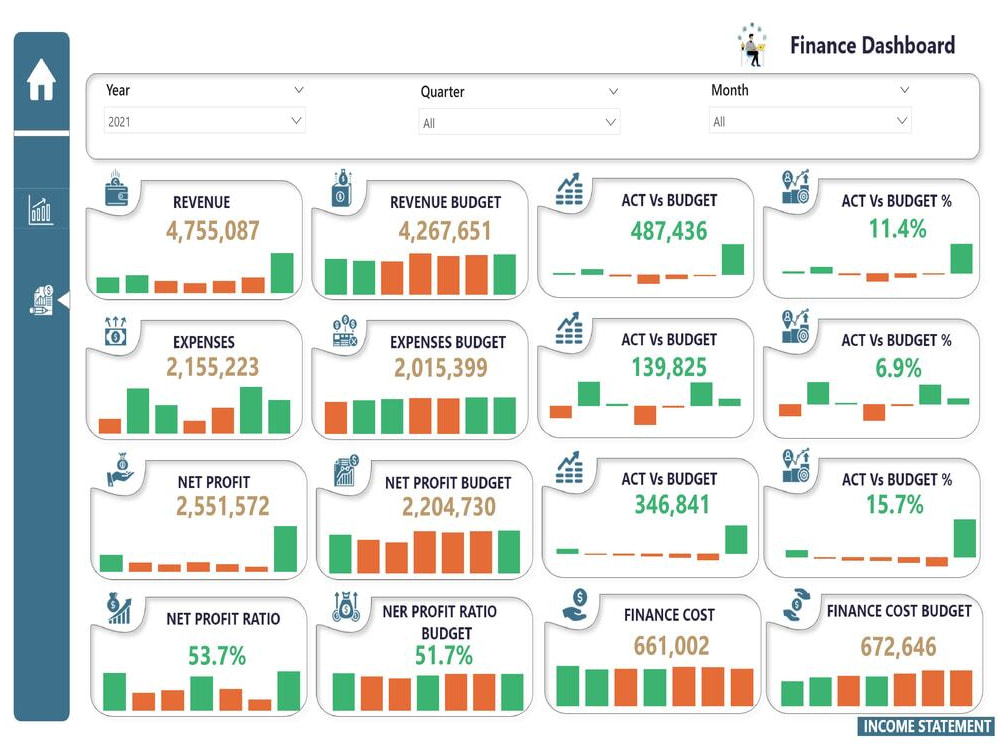
You will get Microsoft Power BI Interactive Dashboard, Report & Data Visualization
Top Rated
Project details
Are you looking for a Microsoft Power BI expert to create interactive dashboards, reports, and data visualizations? I specialize in transforming raw data into actionable insights with stunning, user-friendly dashboards.
My services include:
✅ Custom Power BI Reports & Dashboards
✅ Data Cleaning, Modeling & DAX Calculations
✅ KPI Metrics & Business Intelligence Solutions
✅ Advanced Data Visualization & Storytelling
I ensure high-performance dashboards tailored to your business needs.
Let’s turn your data into decisions
Data Tool
Microsoft Power BIWhat's included
| Service Tiers |
Starter
$50
|
Standard
$100
|
Advanced
$200
|
|---|---|---|---|
| Delivery Time | 2 days | 3 days | 5 days |
Number of Revisions | 1 | 1 | 1 |
Number of Graphs/Charts | 1 | 3 | 7 |
Data Source Connectivity | |||
Web Embedding | - | - | - |
Interactive/Animated Visuals |
Optional add-ons
You can add these on the next page.
Fast Delivery
+$30 - $80
Additional Revision
+$50
Additional Graph/Chart
(+ 1 Day)
+$50
Additional Variation
(+ 1 Day)
+$80
58 reviews
(57)
(1)
(0)
(0)
(0)
This project doesn't have any reviews.
AM
Aaron M.
Mar 3, 2026
Update data file integration in PowerBI
LJ
Leonard J.
Feb 26, 2026
Power Dashboard Development & Training
AM
Aaron M.
Dec 9, 2025
Power BI Setup Assistance Needed
RP
Romain P.
Aug 20, 2025
Power B dashboard, and data
SH
Simone H.
Aug 11, 2025
Retail Sales dashboard
About Umair
Power BI, Data Visualization, Data Analyst, Business Intelligence, DAX
100%
Job Success
Lahore, Pakistan - 9:32 pm local time
✅ 6+ Years of Experience | 100+ Dashboards Delivered | 80+ Happy Clients
⭐ 5-Star Reviews | 💡 Available 18+ Hours Daily
Are you searching for a Microsoft Power BI Data Visualization freelancer who transforms raw data into actionable insights and visually stunning dashboards? I bring expertise in Power BI, Power Automate, and Power Virtual Agent to help you achieve business success through tailored data visualization and automation solutions.
What I Offer:
🟡 Microsoft Power BI Development | Dashboard – Engaging and dynamic visuals
🟡 Data Analysis & Reporting – Extracting insights for better decisions
🟡 Workflow Automation – Streamlined processes with Power Automate
🟡 Chatbot Creation – Interactive solutions with Power Virtual Agent
Industries I Serve:
✔ Retail | Healthcare | Finance | Real Estate
✔ HR | Sales Pipeline | Banking | ITSM
✔ Procurement | Vendor Analysis | Survey Analysis
Key Expertise:
✅ Microsoft Power BI | Dashboard | Business Intelligence | Power Query | Data Analysis
✅ Data Visualization | SQL | Data Modeling | Data Analytics | Data Science
✅ Workflow Automation | Azure Logic Apps | Power Automate | Business Analysis
✅ DAX Optimization | Data Warehousing
Why Work With Me?
🏆 Top-Rated Plus Freelancer with proven success across industries
🎯 Skilled at creating Microsoft Power BI interactive dashboards and automating workflows
🔍 Expert in delivering actionable insights through advanced reporting techniques
Client Success Stories:
"This freelancer is fantastic. The work is highly sophisticated and perfection. I would recommend to anyone who is looking for an expert in MS Power BI dashboard designer and data analysis."
Let’s Get Started!
From data modeling to interactive dashboards and automation, I deliver exceptional results tailored to your business. Whether it’s sales analysis, KPI monitoring, or real-time dashboards, I guarantee solutions that drive success.
📈 Unlock the Power of Data – Let’s collaborate today!
Steps for completing your project
After purchasing the project, send requirements so Umair can start the project.
Delivery time starts when Umair receives requirements from you.
Umair works on your project following the steps below.
Revisions may occur after the delivery date.
Gather and Prepare Data
Connect data sources: Use Power BI’s built-in connectors to gather data from sources like Excel, SQL Server, SharePoint, APIs, etc. Clean and transform data: Use Power Query to Clean and transform data
Create Data Model
Define relationships: If using multiple tables, create relationships between them by linking related columns Optimize data model: Ensure that the tables and relationships are well-structured. Add calculated columns or measures