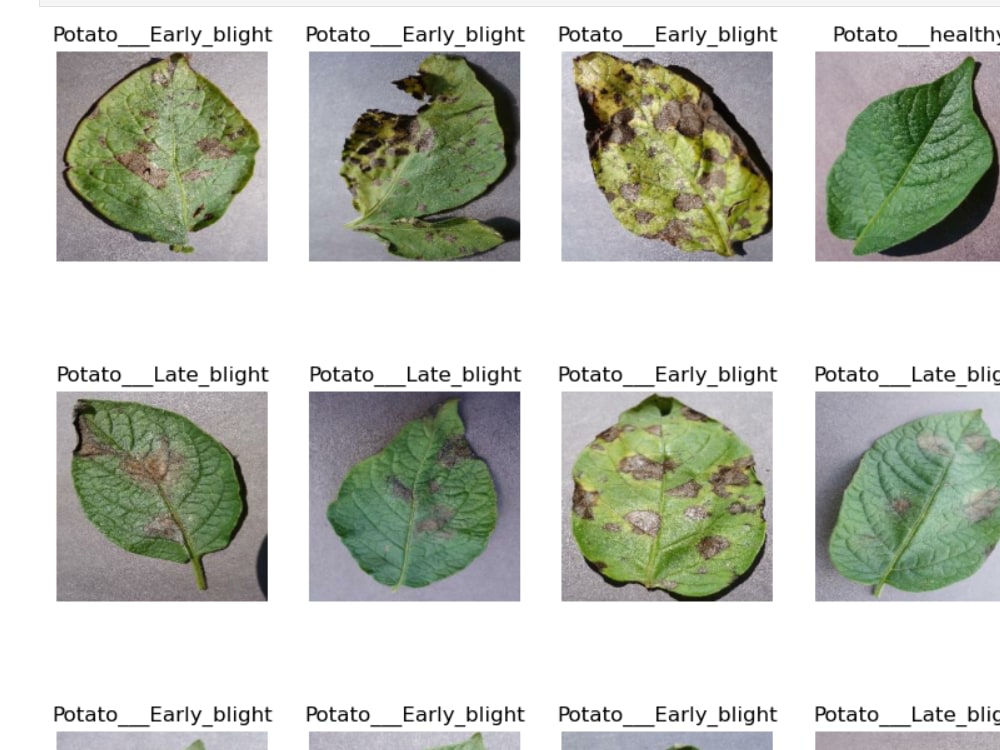
You will get model to predict potato's health
Project details
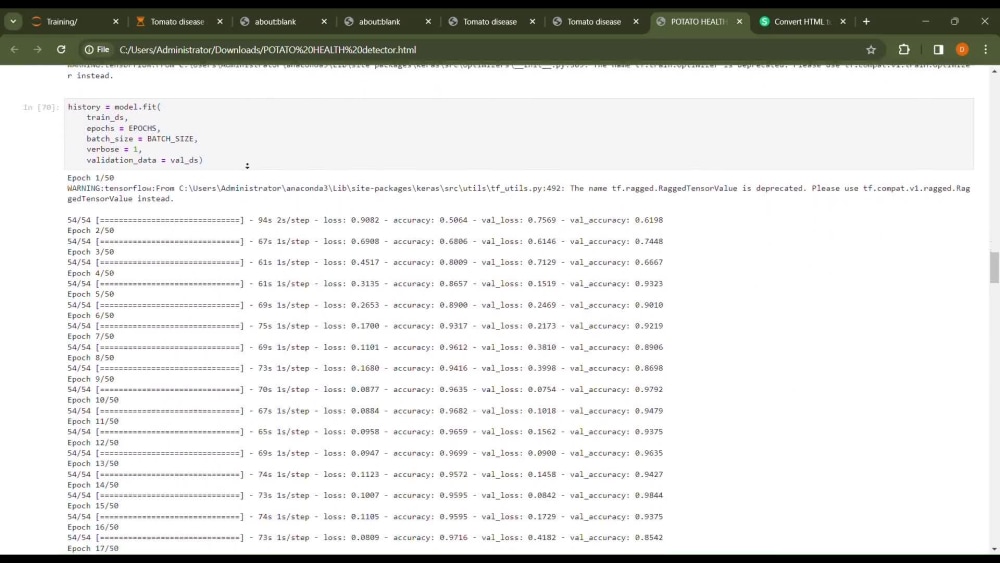
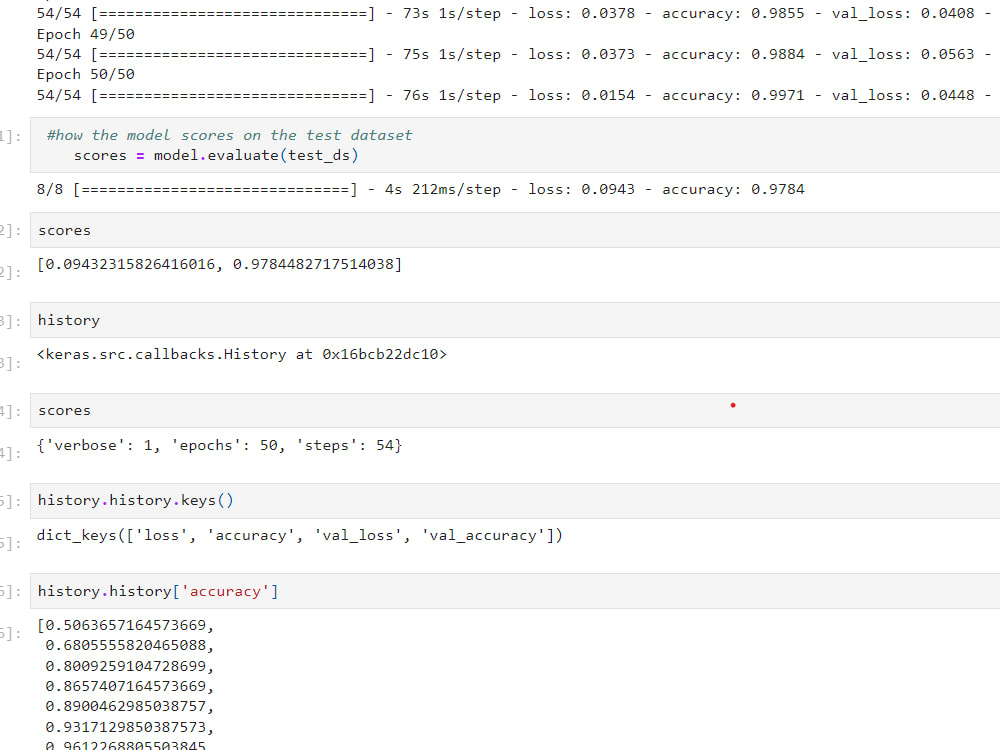
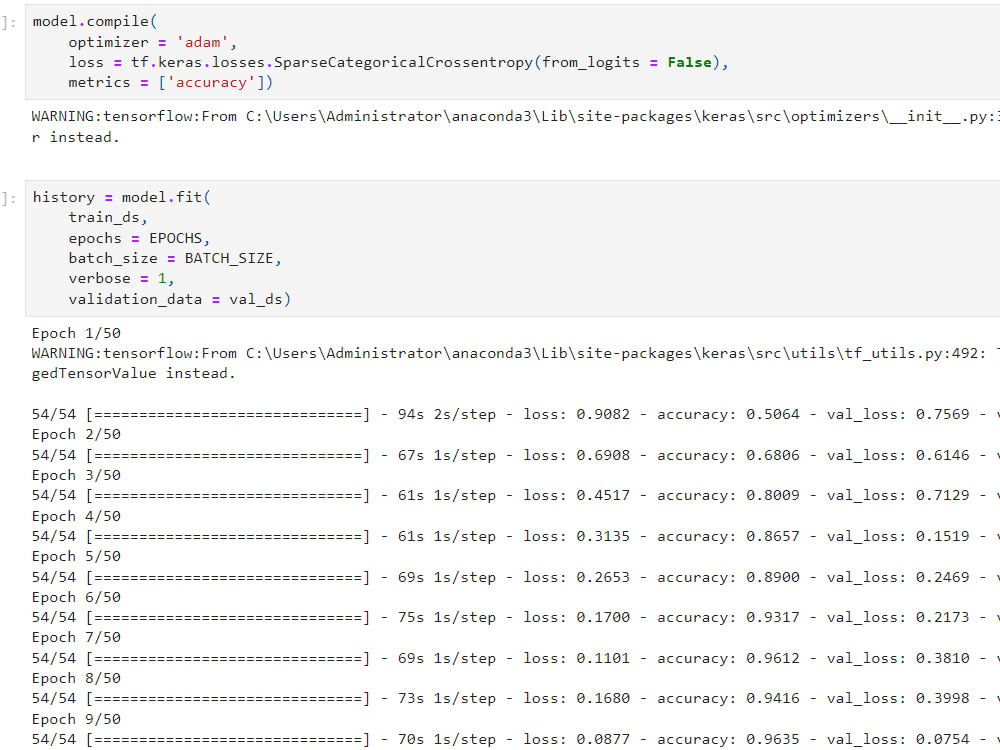
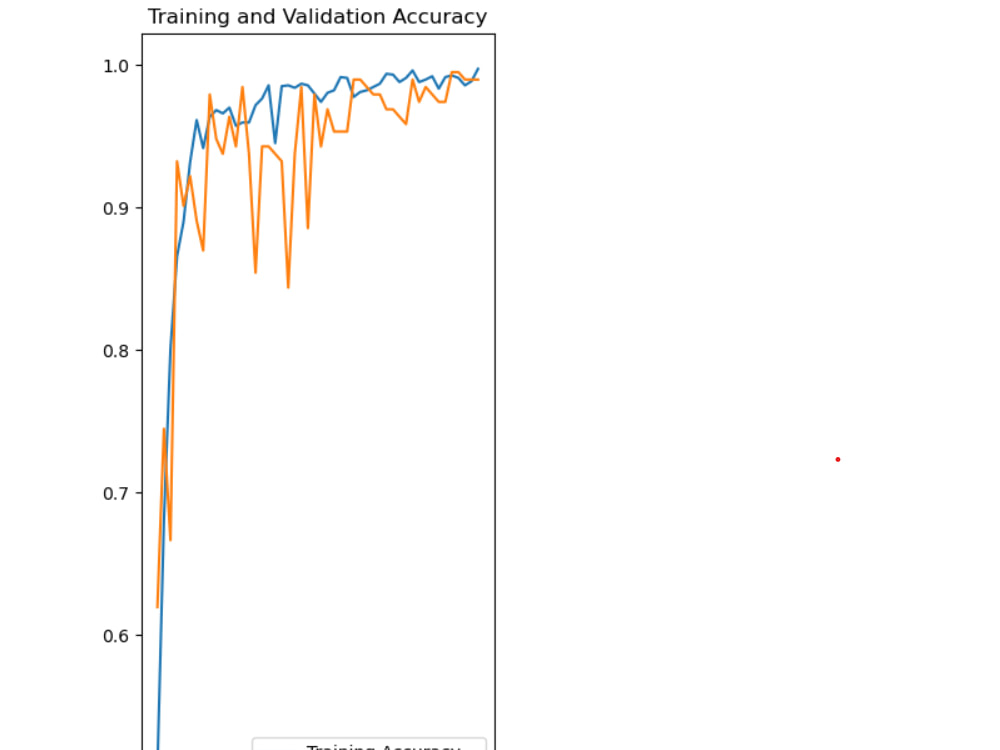
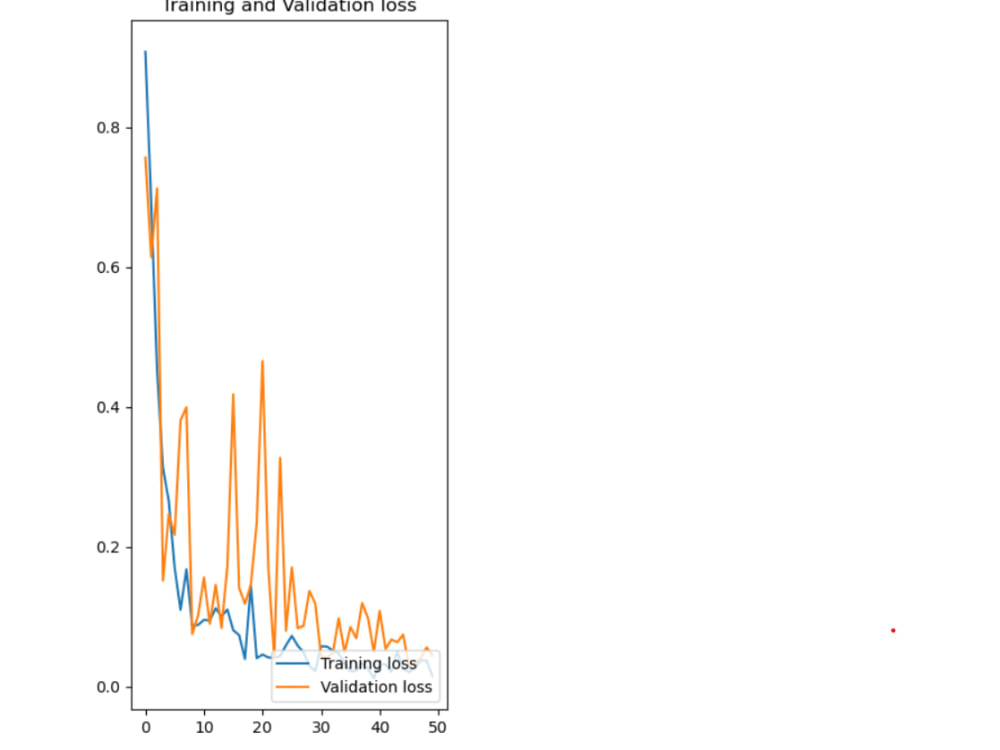
My model has a test accuracy of 98%, you can upload images from various sources, I also provide a simple user experience that will be used to interact with the model.
Machine Learning Tools
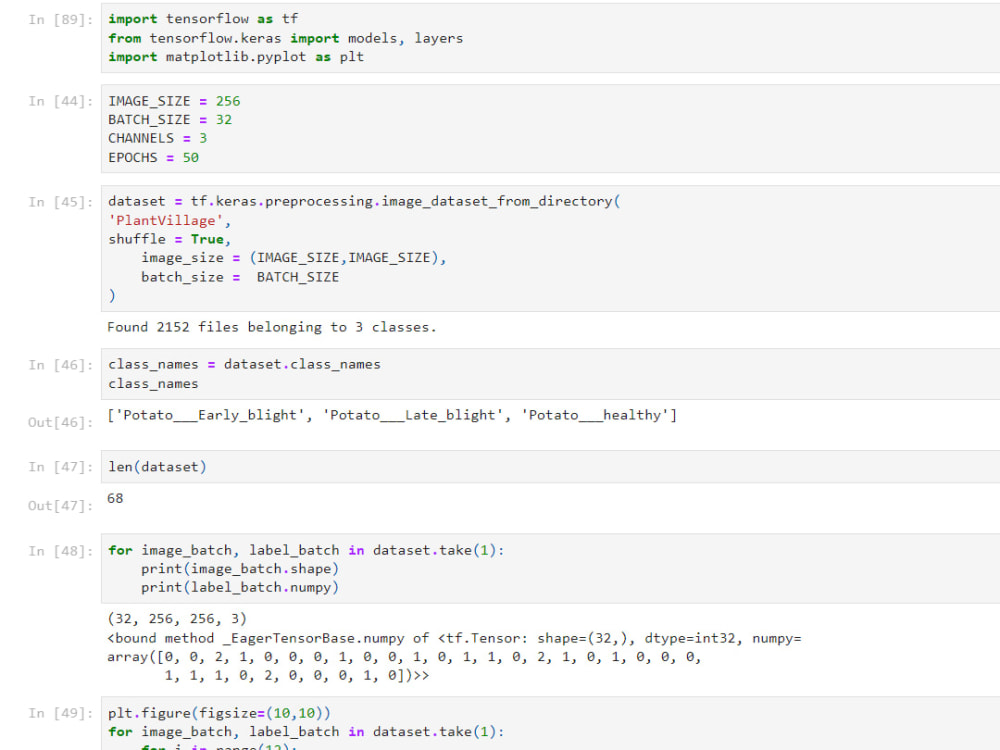
NumPy, OpenCV, Python, PyTorch, TensorFlowWhat's included
| Service Tiers |
Starter
$50
|
Standard
$100
|
Advanced
$170
|
|---|---|---|---|
| Delivery Time | 1 day | 2 days | 5 days |
Number of Revisions | 1 | 2 | 3 |
Number of Model Variations | 1 | 2 | 4 |
Number of Graphs/Charts | 2 | 3 | 4 |
Model Validation/Testing | |||
Model Documentation | |||
Data Source Connectivity | - | ||
Source Code |
Frequently asked questions
About Daniel
Data Engineer
Karatina, Kenya - 4:16 am local time
Data Analyst | Power BI | SQL | Python | Excel | Google Sheets
$13.00–$25.00/hr
Overview
Early-career Data Analyst with 2+ years of hands-on experience in analyzing and visualizing data to solve real-world business problems. Proficient in Power BI, Python, SQL, Excel, and Google Sheets, with additional experience using tools like Seaborn, Matplotlib, and Plotly. My work focuses on delivering actionable insights to stakeholders and improving decision-making through clean, accurate data.
My domain experience spans sales, customer service, academic platforms, and NGO/impact-driven work, with contributions to projects that have achieved measurable business results—such as a 30% increase in sales at Menengai Oil Refineries through customer segmentation insights.
Key Projects & Contributions
Sales Insight Dashboard: Helped Menengai Oil Refineries identify high-value customers using Python and Excel analytics, boosting sales revenue by 30% in 6 months.
Customer Support Chatbot: Designed and deployed a chatbot for Menengai’s customer care team, improving response time and client satisfaction.
Academic Web Platform Analytics: Built a Django-based platform for student material access with backend analytics for usage and resource tracking.
Data Cleaning & Visualization: Conducted exploratory data analysis (EDA), data validation, and visual storytelling using Seaborn and Matplotlib to support business reporting.
Automated Reporting Tools: Created Excel dashboards and semi-automated templates for tracking performance metrics and monitoring data quality.
Technical Skills
Programming & Scripting: Python (Pandas, NumPy, Seaborn), SQL, Excel (Pivot Tables, VLOOKUP, Macros)
Data Visualization: Power BI, Excel Dashboards, Matplotlib, Plotly
Tools & Platforms: Google Sheets, Jupyter Notebook, VS Code, Git
Other: Web development (HTML/CSS/JS), Django (for data-driven apps)
Certifications
Data Analyst Professional Certificate – DataCamp
ITIL Foundation Certificate in IT Service Management – Alison
Power BI Fundamentals – (in progress or planned, if applicable)
Achievements
Designed and implemented multiple dashboards and reports for sales and education projects with clear ROI.
Participated in Kaggle and DataCamp competitions to strengthen data science and machine learning skills.
Contributed to projects that bridge data and social impact, such as workforce training and education.
Steps for completing your project
After purchasing the project, send requirements so Daniel can start the project.
Delivery time starts when Daniel receives requirements from you.
Daniel works on your project following the steps below.
Revisions may occur after the delivery date.
Provide a description of your problem
Receive dataset link or dataset zip folder from client. send me requirements report on how you want your dataset to look like, send model to the client