You will get observability for your Go backend with Prometheus, OpenTelemetry, Grafana
Project details
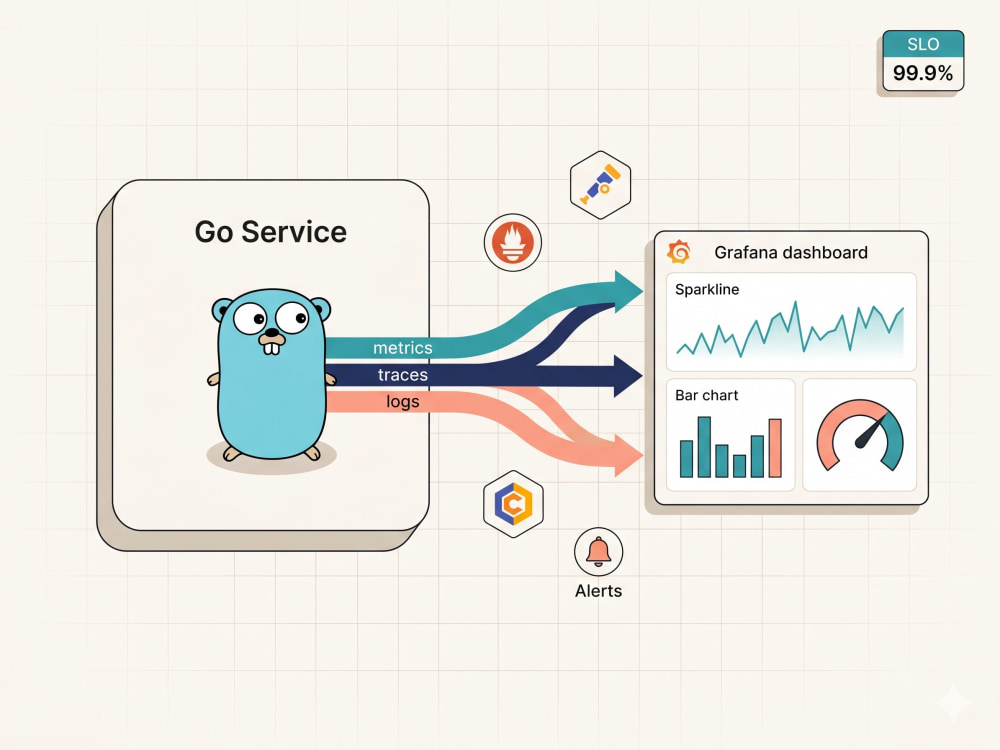
You will get a production-grade observability stack for your Go (Golang) backend: Prometheus metrics, OpenTelemetry traces, Grafana dashboards, and actionable alerts so your team can find and fix issues in minutes instead of hours. I am a Staff Backend Engineer with 20+ years operating high-traffic distributed systems where observability is the difference between a 5-minute incident and a 5-hour outage.
This is the right fit if your team is flying blind on production behavior, you are spending too long debugging incidents, you have metrics but no useful dashboards or alerts, or you need to formalize SLOs and on-call runbooks.
What you receive:
• Idiomatic Go instrumentation (Prometheus client, OTel SDK, slog/zap)
• RED + USE metrics for HTTP handlers, DB calls, queues, background jobs
• Distributed tracing across services with correlation IDs
• Grafana dashboards tuned to your service (latency, errors, saturation, business KPIs)
• Alertmanager rules with sensible thresholds and routing
• SLO definitions, error budgets, and on-call runbook (Advanced tier)
• 30-minute walkthrough call + one revision round
I communicate clearly in English, Portuguese, and Spanish.
Web Programming Project
Data DashboardProgramming Languages
Python, Java, GoCoding Expertise
Performance Optimization, SecurityWhat's included
| Service Tiers |
Starter
$199
|
Standard
$499
|
Advanced
$1,199
|
|---|---|---|---|
| Delivery Time | 5 days | 10 days | 14 days |
Number of Revisions | 1 | 2 | 3 |
Source Code |
Optional add-ons
You can add these on the next page.
Fast Delivery
+$100 - $250
Additional Revision
+$75
Extra dashboard
(+ 2 Days)
+$100
Alerting rules + on-call runbook
(+ 3 Days)
+$200
SLO/SLI definition workshop
(+ 2 Days)
+$250Frequently asked questions
About Alessander
Staff Backend Engineer - Go, Microservices, Distributed Systems
Florianopolis, Brazil - 5:14 am local time
I operate through a US-based LLC, making B2B engagement seamless for North American and European organizations.
What I architect:
- Event-Driven Microservices and Serverless (Golang, AWS Lambda, GCP)
- Internal Developer Platforms (IDP) that cut provisioning from days to minutes
- Observability stacks (Datadog, SOC2) that slash MTTR by 40%
- Cloud Cost Optimization - 30% API latency gains on high-volume ERP systems
- Legacy Modernization - monolith-to-microservices with zero downtime
Core stack: Golang, Java, Python, AWS, GCP, Terraform, Kubernetes, Kafka, PostgreSQL, Redis, Datadog
Google Professional Cloud Architect certification in progress. Postgraduate specializations in Software Architecture and Database Administration.
Open to Staff / Principal / Tech Lead engagements - remote, contract or full-time.
Steps for completing your project
After purchasing the project, send requirements so Alessander can start the project.
Delivery time starts when Alessander receives requirements from you.
Alessander works on your project following the steps below.
Revisions may occur after the delivery date.
Discovery & instrumentation plan
I review your service, identify what to instrument (RED/USE metrics, traces, key logs), and propose the stack (Prometheus, OpenTelemetry, Grafana, Loki/Tempo if needed). I confirm scope with you.
Instrument the Go service
I add Prometheus metrics (golang_prometheus, custom RED/USE), OpenTelemetry tracing (HTTP/DB spans), and structured logging via slog or zap. Keep cardinality bounded.