You will get Dashboard & Dax consultation from Microsoft certified Power Bi Developer
Project details
Hi Thanks for visiting my service page
Crafting Compelling Data Narratives: Specializing in dynamic dashboard creation and data storytelling, I excel in transforming raw numbers into engaging narratives that resonate with your audience. Leveraging top-tier tools like Power BI, Tableau, and more, I bring your data to life, making it relatable and impactful.
Seamless API Integration for Comprehensive Insights: Data is more than just numbers; it's interconnected insights waiting to be discovered. With expertise in seamless API integration, I ensure your data ecosystem is robust and comprehensive. By incorporating external data sources, I unlock valuable layers of information, providing a holistic view of your business landscape.
Experience and Expertise: With a proven track record in creating visually stunning dashboards and delivering persuasive presentations, I bring a blend of creativity and analytical rigor to every project. Whether it's extracting key KPIs or aggregating complex data sets, I'm dedicated to exceeding your expectations and driving actionable insights.
Let's collaborate to elevate your data strategy and unlock the full potential of your business insights.
Data Tool
Microsoft Power BIWhat's included
| Service Tiers |
Starter
$40
|
Standard
$100
|
Advanced
$300
|
|---|---|---|---|
| Delivery Time | 1 day | 2 days | 5 days |
Number of Revisions | Unlimited | Unlimited | Unlimited |
Number of Graphs/Charts | 4 | 6 | 10 |
Number of Variations | 1 | 2 | 6 |
Data Source Connectivity | |||
Web Embedding | - | ||
Interactive/Animated Visuals | - | - |
Frequently asked questions
33 reviews
(22)
(7)
(2)
(1)
(1)
This project doesn't have any reviews.
NS
Naidu S.
Sep 3, 2025
Azure data factory - Pipelines
OA
Omar A.
Apr 16, 2025
Tableau Expert
FT
Falguni T.
Mar 27, 2025
Data engineer with azure synapse
RA
Robert A.
Dec 14, 2024
Power Bi Report Development for Quality Management Module
ST
Surya T.
Aug 5, 2022
Need to create 10 visualizations and dashboard using Tableau
I enjoyed working with Santosh. He is really amazing to work with and very knowledgeable in Tableau & Analytics.
Provided great design and Dynamic dashboard, which was beyond my expectation. Thank you Santosh, look forward to working with you again in near future.
Provided great design and Dynamic dashboard, which was beyond my expectation. Thank you Santosh, look forward to working with you again in near future.
About Santosh
Azure Data engineer |ADF |GCP|Databricks|Snowflake
80%
Job Success
Jamalpur, India - 2:38 pm local time
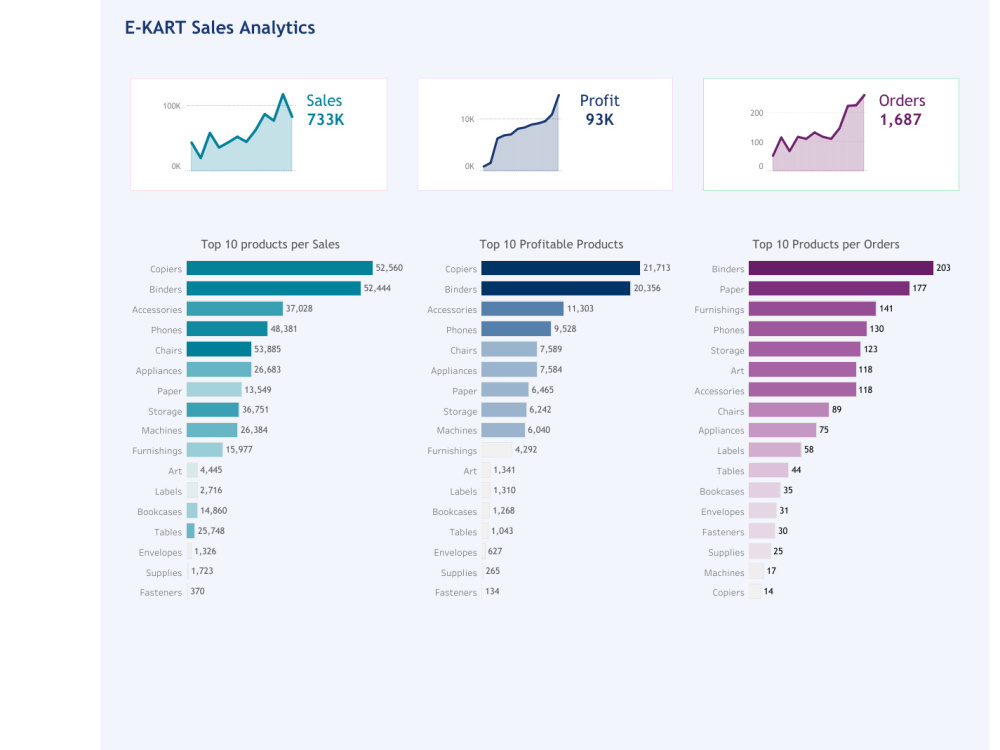
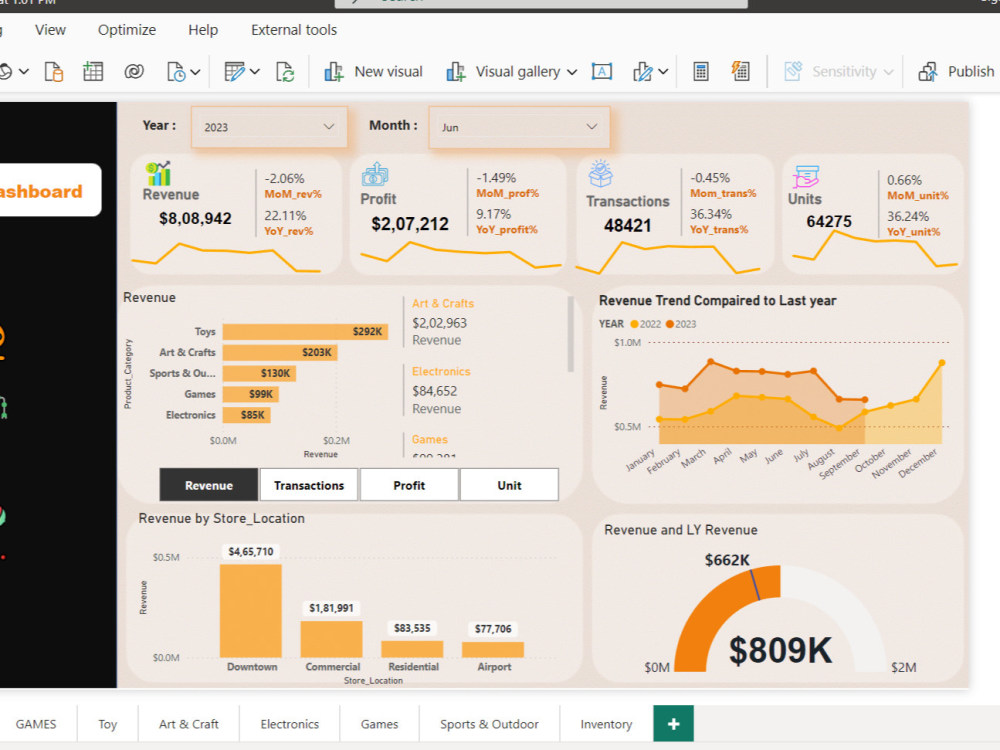
I can unlock the power of your data by building great and interactive dashboards and engaging reports that inspire smarter business decisions.
My dashboards will transform your raw data into the metrics and dimensions needed to create easy-to-understand reports and dashboards by SME’s and Leaders.
I am an advanced data visualization practitioner in reporting, business intelligence, KPIs, data cleansing, data modelling, data transformation and business development.
SKILLS:
☁️ Cloud: Azure DATA FACTORY,AWS,Google Cloud,DATABRICKS,Azure Devops CI&CD PIPELINES
👨 Databases: SQL Server, PostgreSQL, MySQL, MONGO DB
⚙️ Data Integration/ETL: SSIS ,ALTERYX
⚙️ MSBI TOOLS: Power Automate, Power APPS
💻 Visualization: PowerBI,Tableau,Tableau Prep,Power QUERY,SSRS,Qlikview, Qliksense,Klipfolio,Google Data studio, Looker and EXCEL
🔑 Scripting - Python for API Integrations and Data Processing
FIGMA-UI & UX design
Industries we have worked in:
⭐ Manufacturing
⭐ Marketing
⭐ Financial (Investment and management)
⭐ Healthcare
⭐ Retail (Ecommerce and Physical)
⭐ Consulting
⭐ Education
⭐ Customer Behavior/Insights
⭐ Automotive
⭐ Legal Services
⭐ Film Production
Working with companies located in:
🌎 United States (PST to EST, GMT -8 to GMT -5)
🌎 United Kingdom (GMT)
🌎 Spain (CET, GMT +1)
🌎 Netherlands (CET, GMT +1)
🌎 Israel (IST, GMT+2)
🌎 Australia (ACT, GMT + 11)
I have a great experience with the following project categories:
1) Data Analytics
2) UI & UX Design Figma/Adobe Xd
3) Data Extraction, Data Mining
4) Data Engineering
5) Anything with data
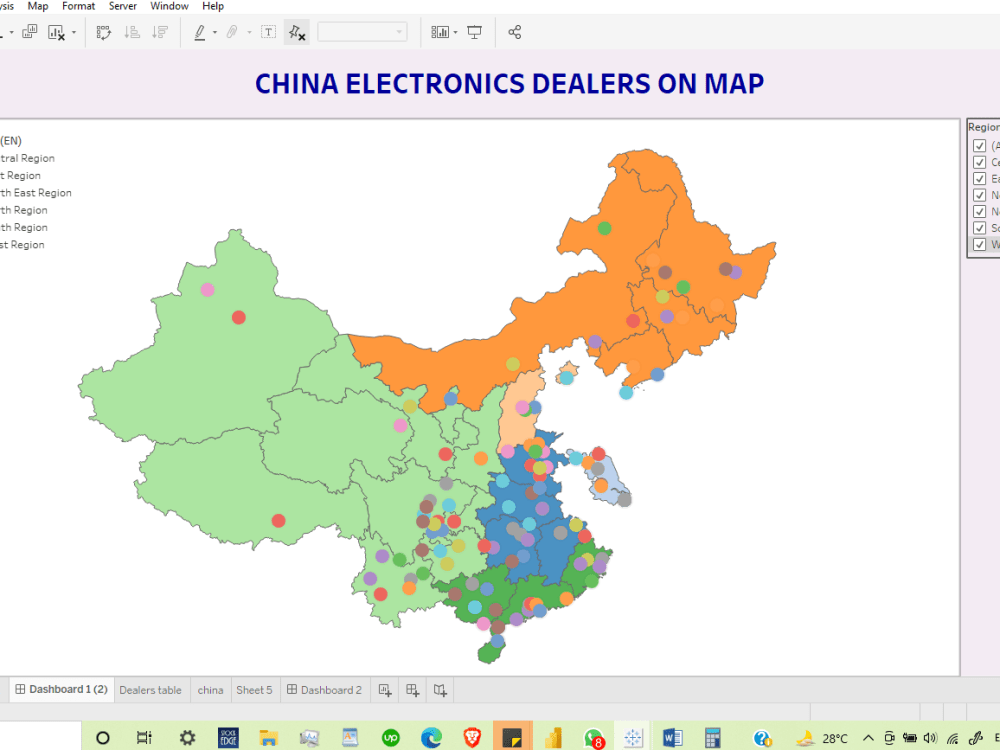
6) Map visualization
7) Python Exploratory data analysis
8) Predictive analysis, and forecasting.
Thanks, Regards
Santosh Kr
Top Rated PLus
Steps for completing your project
After purchasing the project, send requirements so Santosh can start the project.
Delivery time starts when Santosh receives requirements from you.
Santosh works on your project following the steps below.
Revisions may occur after the delivery date.
Purchase the project as per your requirement
Hey, you can order as per your requirement,If your requirement not available here then just inbox me for more detail.
After starting project stay connected for requirements
Hey, you have stayed with me after starting the project because I will need you to ask question on your requirement.