You will get Power BI HR Analytics dashboard immediately

Project details
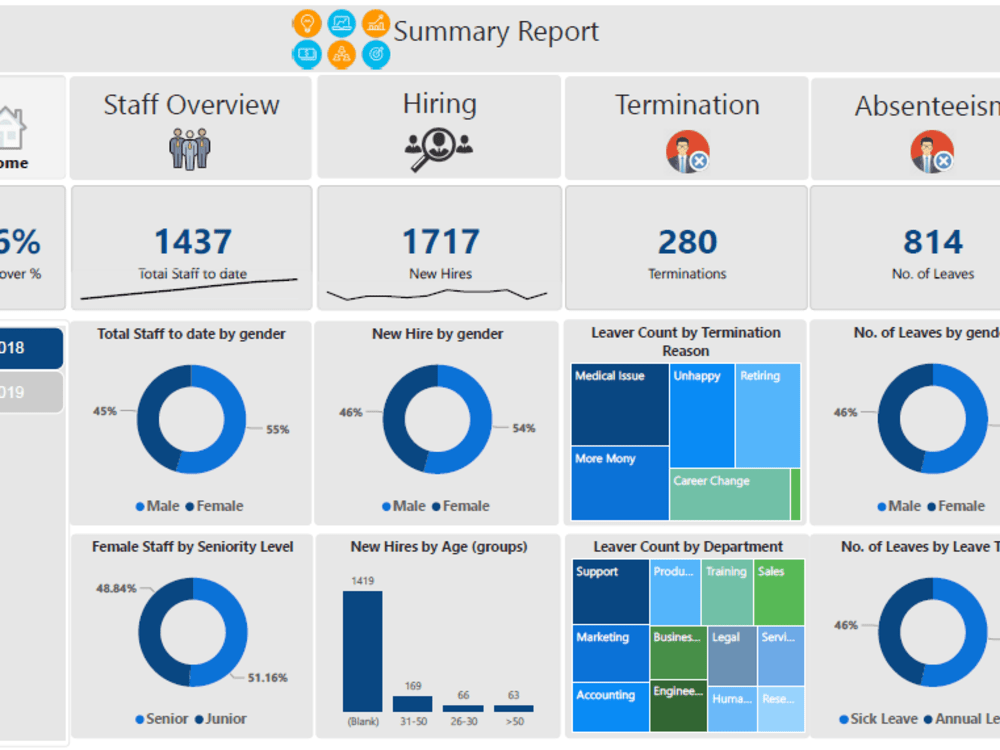
Power BI HR Analytical report contains 8 pages for analyzing and visualizing:
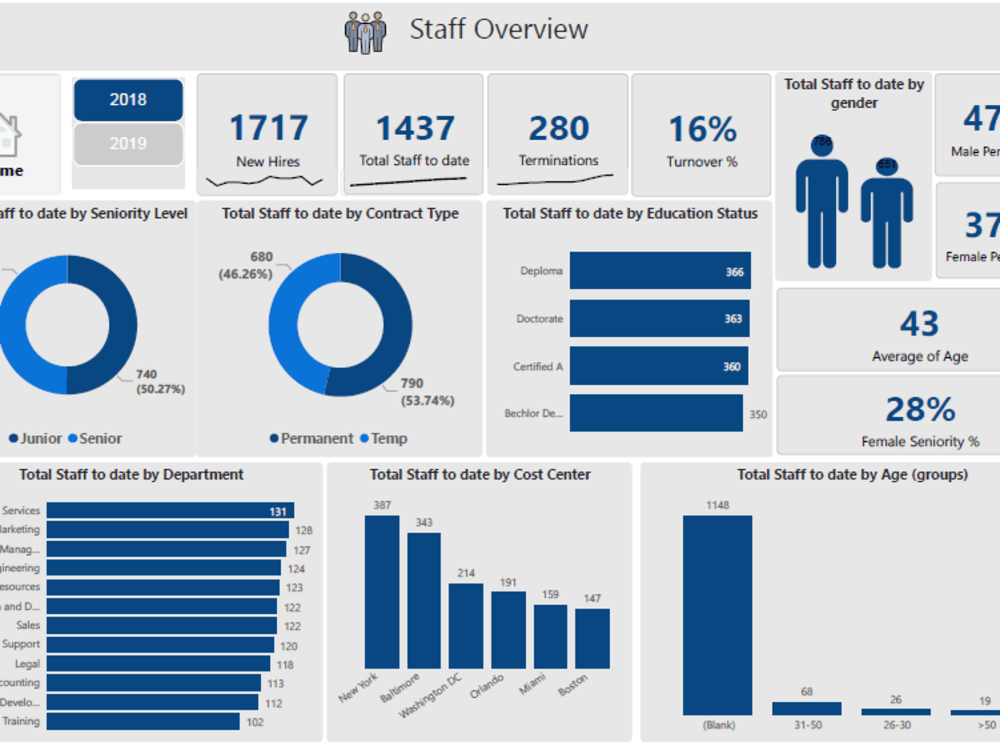
1- Staff overview
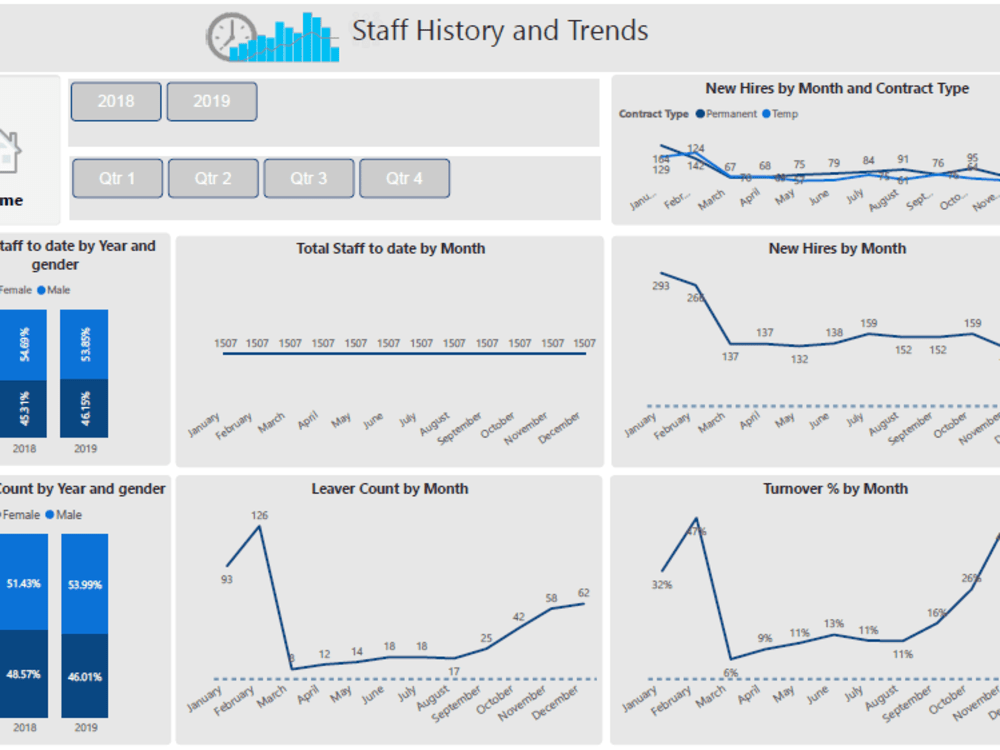
2- Historical analysis
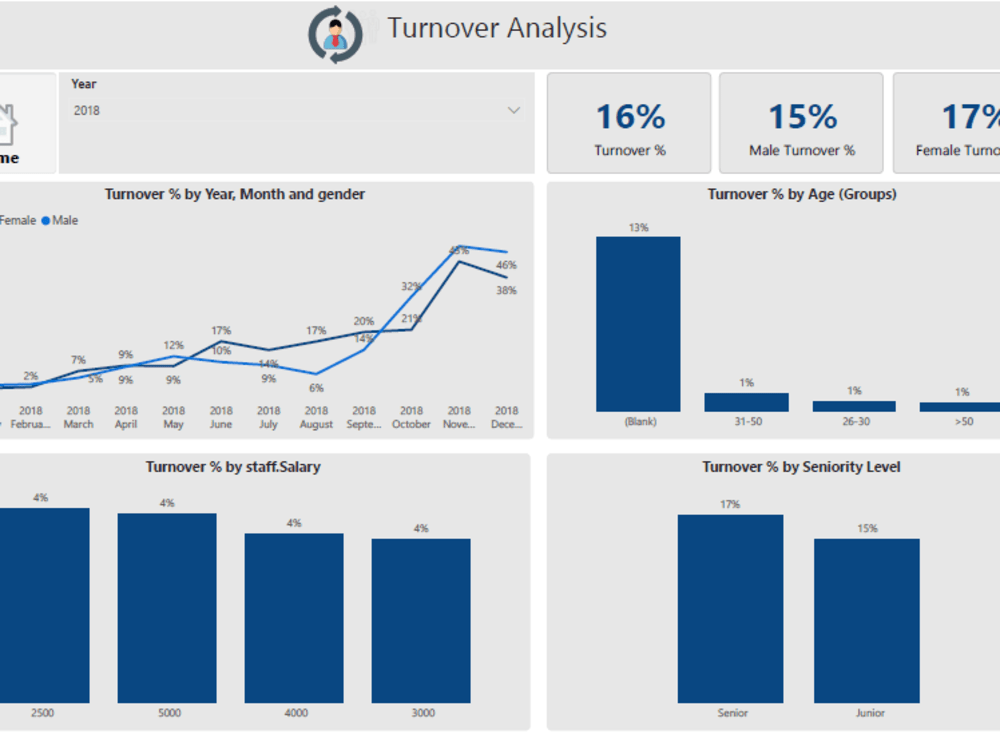
3- Turnover analysis
4- Departments analysis
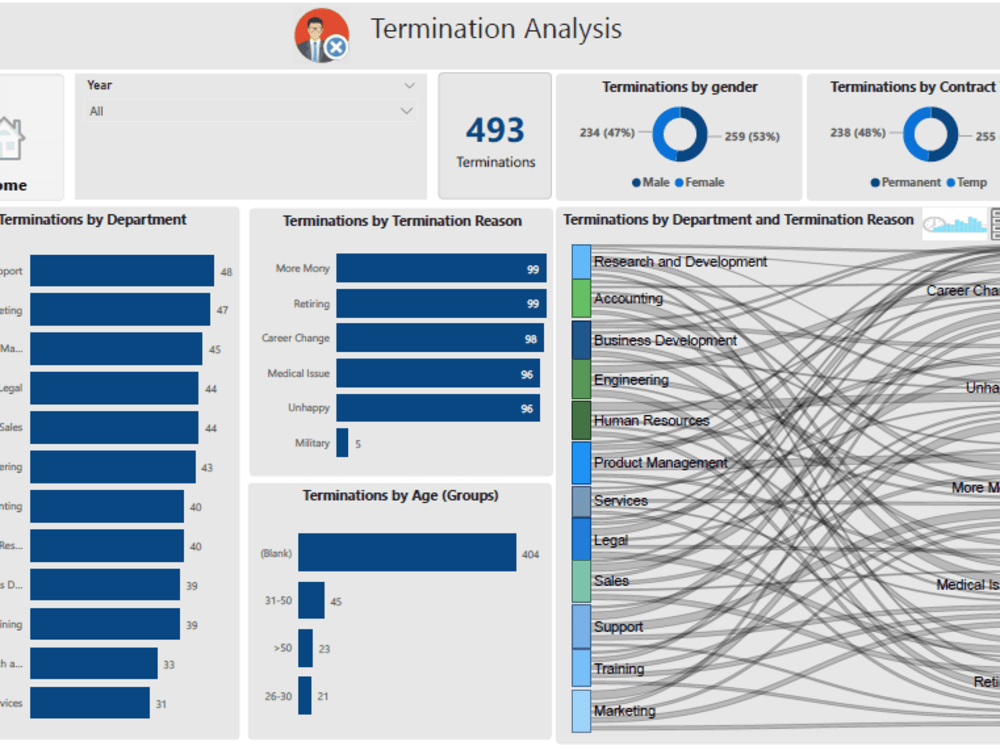
5- Termination analysis
6- Absenteeism
7- Termination analysis
8- Salary analysis
The dashboard is ready to connect with your data directly in MS Excel Format and I can implement it with MS SQL Server Database if needed.
1- Staff overview
2- Historical analysis
3- Turnover analysis
4- Departments analysis
5- Termination analysis
6- Absenteeism
7- Termination analysis
8- Salary analysis
The dashboard is ready to connect with your data directly in MS Excel Format and I can implement it with MS SQL Server Database if needed.
Data Tool
Microsoft Power BIWhat's included $100
These options are included with the project scope.
$100
- Delivery Time 1 day
- Number of Revisions 1
- Data Source Connectivity
- Interactive/Animated Visuals
16 reviews
(16)
(0)
(0)
(0)
(0)
This project doesn't have any reviews.
SP
Stephen P.
Aug 16, 2025
HR Focus - Power BI Work
Professional and easy to work with. Would Highly reccomend.
SP
Stephen P.
Jul 28, 2025
Power BI Dashboard
AA
Ahmad A.
Nov 13, 2023
Power PI Dashboard, HR Report
It was an excellent experience. I needed a user-friendly dashboard and Ahmed made it happen! I highly recommend him. I think you will find he is accommodating, pleasant, skilled, and timely.
MA
Mahmoud A.
Jan 25, 2023
Database dashboard
Thank you Mr. Ahmed for the professionalism and good solutions you provided to achieve my idea.
EC
Erica C.
Jan 4, 2023
Power BI HR analytics full version
It was an excellent experience. I needed a user-friendly dashboard and Ahmed made it happen! I highly recommend him. I think you will find he is accommodating, pleasant, skilled, and timely.
About Ahmed
BI consultant | Power BI Expert | Data analyst | Data visualization
100%
Job Success
New Cairo City, Egypt - 12:46 am local time
I am more than 15 years of experience in data collection, data storage, and data visualization.
Also, I have excellent experience in database, data warehouse, and multi-dimensional reporting design and implementation.
I can help you to analyze and visualize your data to produce professional statistical reports.
Kindly find below a summary of my qualifications:-
1- Database and data warehouse:
- Database and data warehouse designing and implementation using SQL Server.
- Multi-dimensional data analysis using MS SQL server and MS analysis services.
- Microsoft SQL Server Integrated Services (SSIS).
- Creating visualized reports using MS Power BI
- MS Access database and MS access VBA and forms design and programming and reports.
- Creating visualized reports using Google Data Studio.
2- MS Excel:
- Analyzing data using MS Excel.
- Making advanced reports using MS Pivot Table and Excel.
- Professional reports using MS Excel power view.
- MS Excel VBA and macro
3- MS Word
- Professional Writing reports using MS Word.
- Linking word with MS Excel and MS SQL server to produce dynamic reports.
4- Good experience in searching and collecting data from the internet and store it in different formats.
Steps for completing your project
After purchasing the project, send requirements so Ahmed can start the project.
Delivery time starts when Ahmed receives requirements from you.
Ahmed works on your project following the steps below.
Revisions may occur after the delivery date.
just tell me your requirements or changes on the current dashboard
Send me your data (if available)
if you already have your own data please send me a sample of it to see the structure of your data source and if needed any manipulation or transformation I will do it.