You will get expert Water Quality Index predictions with XGBoost & SHAP
Project details
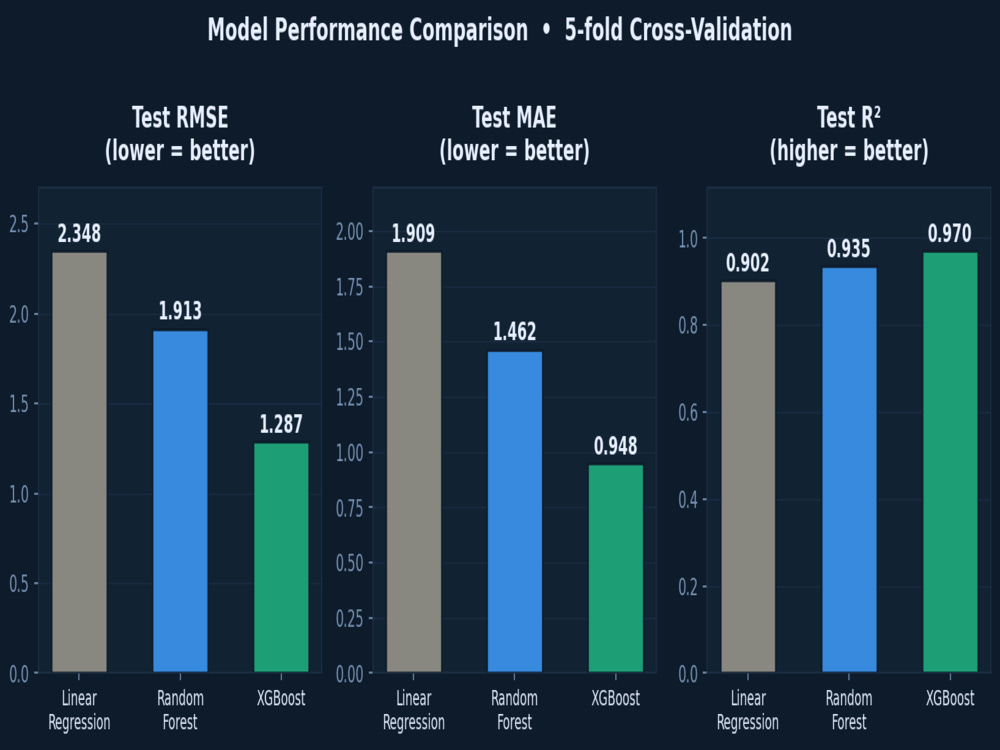
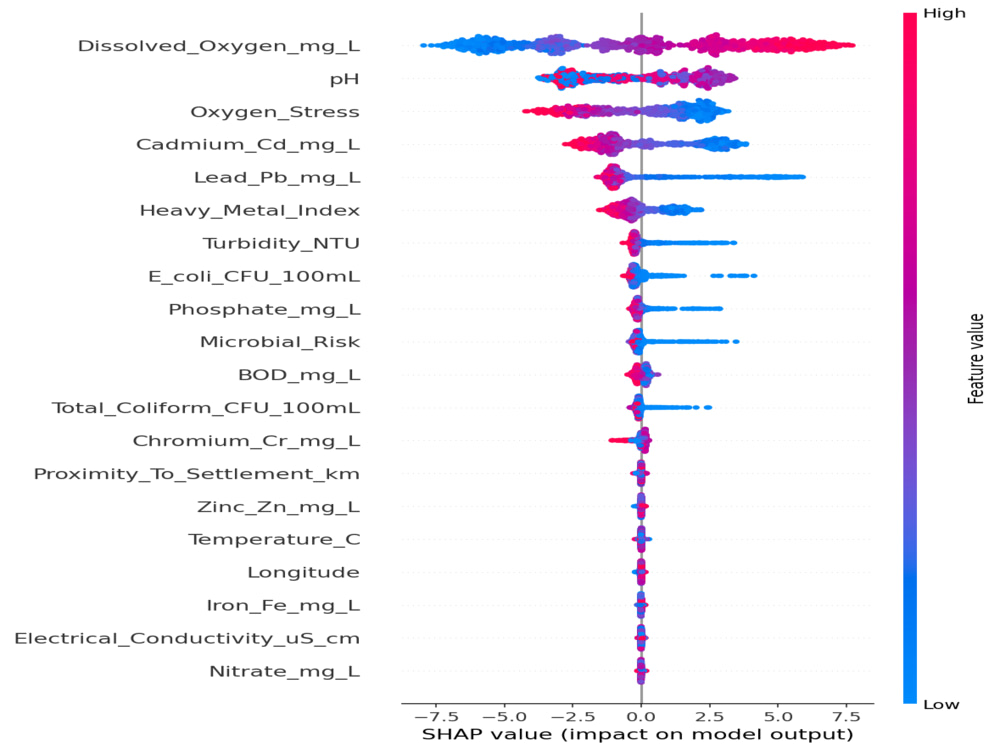
I build ML pipelines to predict Water Quality Index (WQI) from your physicochemical data. Using XGBoost, Random Forest, and Linear Regression, I identify the best model (R² > 0.90) and explain key drivers via SHAP analysis.
DELIVERABLES:
• Custom WQI calculation (WHO standards)
• 3-model comparison with 5-fold CV
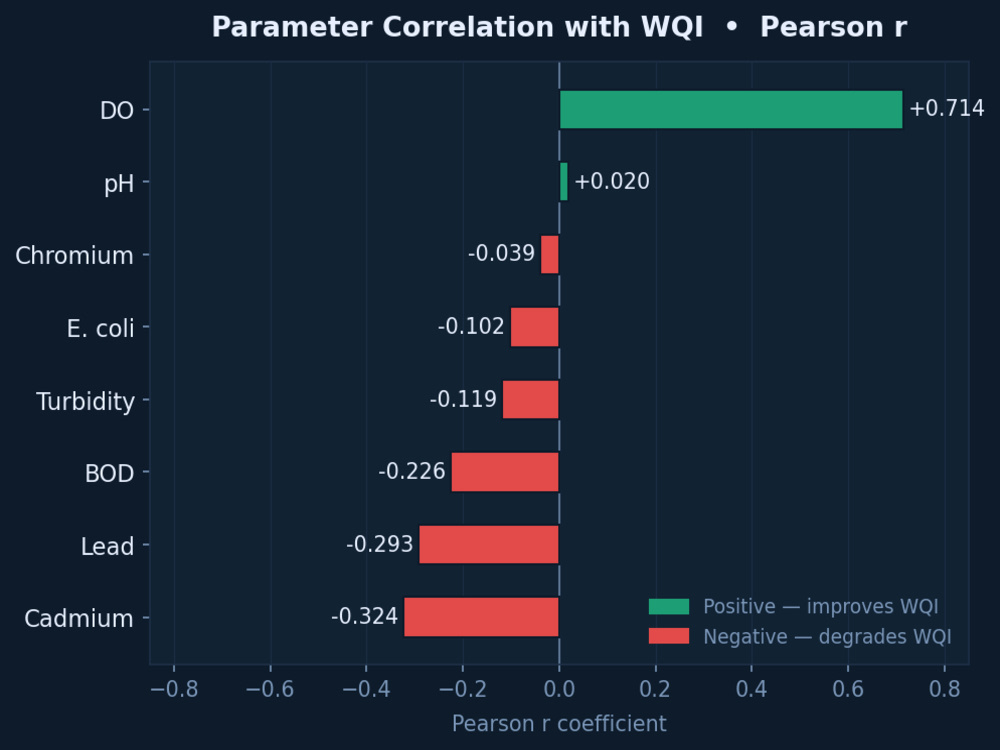
• SHAP explainability report
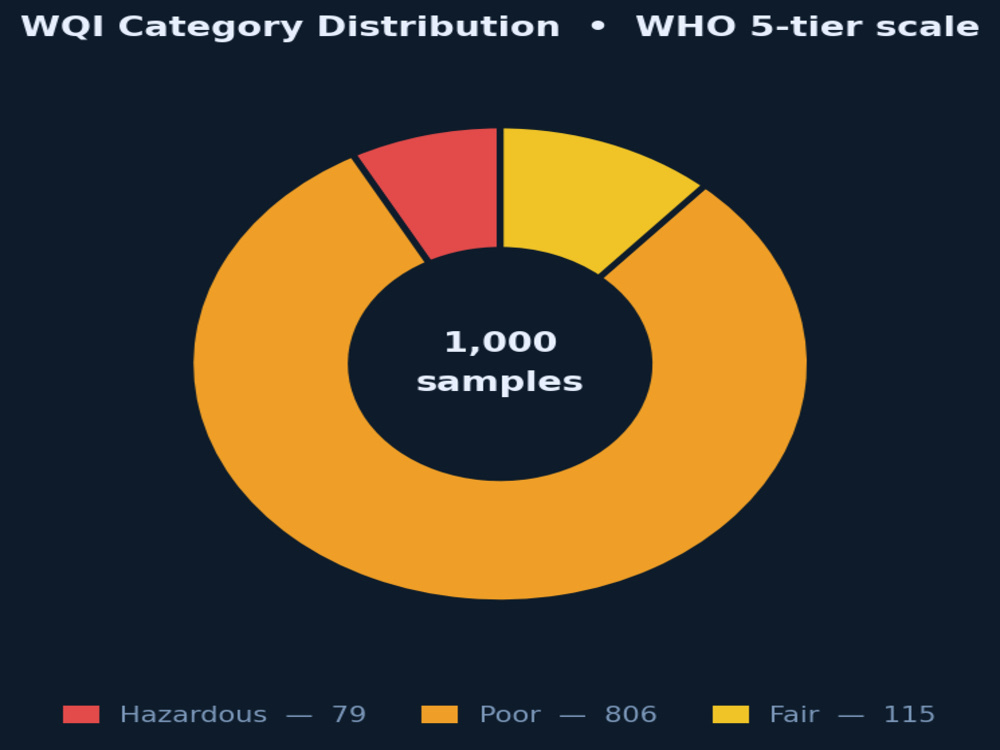
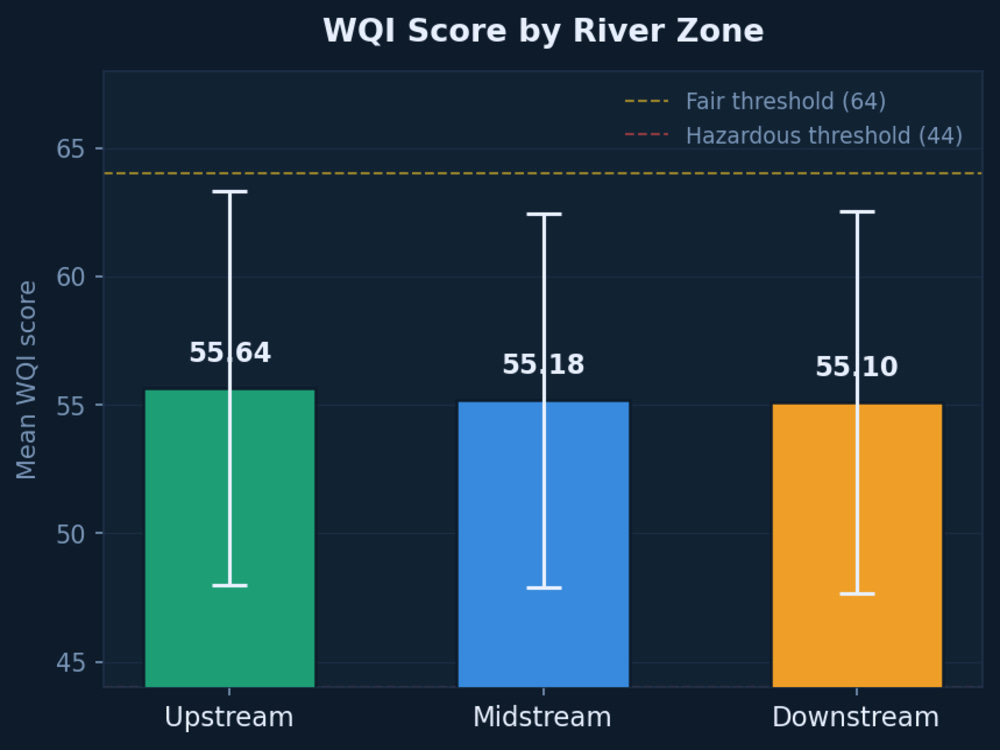
• 9 visualizations (distribution, spatial, trends)
• Interactive Folium pollution map
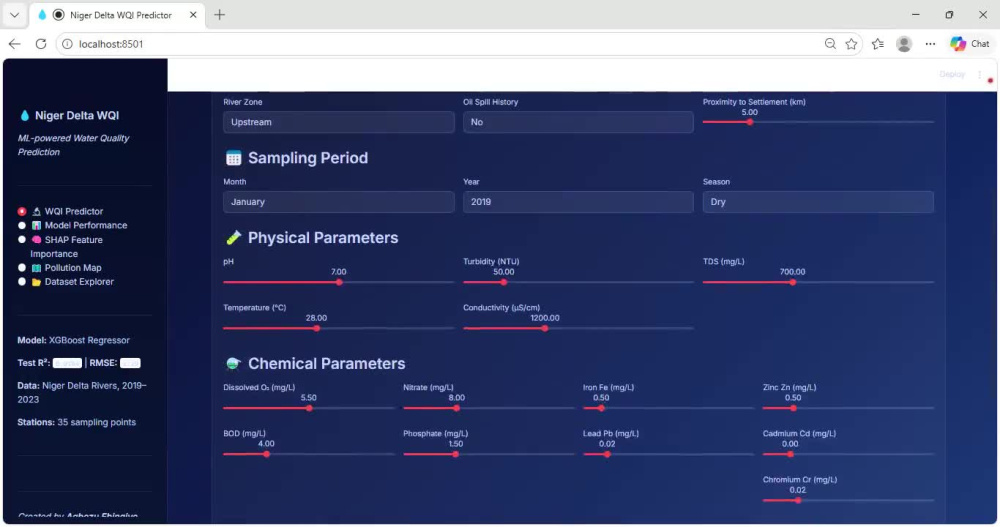
• Streamlit dashboard (cloud deployed)
IDEAL FOR: Environmental agencies, oil/gas companies, NGOs, municipalities monitoring river health.
REQUIREMENTS: Your water quality data (Excel/CSV with pH, DO, heavy metals, etc.) or coordinate boundaries for data collection.
TECH: Python | XGBoost | SHAP | Folium | Streamlit | MLflow
See my Niger Delta portfolio: 16 rivers, 35 stations, 93.9% accuracy.
DELIVERABLES:
• Custom WQI calculation (WHO standards)
• 3-model comparison with 5-fold CV
• SHAP explainability report
• 9 visualizations (distribution, spatial, trends)
• Interactive Folium pollution map
• Streamlit dashboard (cloud deployed)
IDEAL FOR: Environmental agencies, oil/gas companies, NGOs, municipalities monitoring river health.
REQUIREMENTS: Your water quality data (Excel/CSV with pH, DO, heavy metals, etc.) or coordinate boundaries for data collection.
TECH: Python | XGBoost | SHAP | Folium | Streamlit | MLflow
See my Niger Delta portfolio: 16 rivers, 35 stations, 93.9% accuracy.
Machine Learning Tools
MLflow, pandas, Python, scikit-learn, XGBoostWhat's included
| Service Tiers |
Starter
$400
|
Standard
$500
|
Advanced
$1,000
|
|---|---|---|---|
| Delivery Time | 2 days | 2 days | 3 days |
Number of Revisions | 1 | 2 | 3 |
Number of Model Variations | 1 | 3 | 3 |
Number of Scenarios | 1 | 2 | 4 |
Number of Graphs/Charts | 3 | 9 | 11 |
Model Validation/Testing | |||
Model Documentation | |||
Data Source Connectivity | |||
Source Code |
Optional add-ons
You can add these on the next page.
Fast Delivery
+$200 - $600
Additional Revision
+$150
Additional Model Variation
(+ 1 Day)
+$300
Additional Scenario
+$100
Additional Graph/Chart
+$75
Executive PDF Report
+$250
Live Training Call
+$400
3-Month Support
+$900Frequently asked questions
About Ebingiye Nelvin
Data Scientist | Python | PySpark | ML | Streamlit Dashboard
Port Harcourt, Nigeria - 8:26 am local time
I help businesses, organizations, and teams turn complex data into clear, actionable insights especially for geospatial, environmental, and data-intensive projects.
Whether you're working with business data, climate datasets, or large-scale structured data, I can help you analyze it, model it, and present it in a way that drives better decisions.
🔹 What I can help you with:
Data cleaning, analysis, and visualization (Python, Pandas, SQL)
Machine learning models (classification, regression)
Large-scale data processing using PySpark
Geospatial and spatial analysis (GIS, remote sensing)
Interactive dashboards (Streamlit, Plotly)
Automation and data pipelines
🔹 Proven Work:
✔ Renewable Energy Site Selection System
Built a machine learning model with 91.25% accuracy to identify optimal solar and wind farm locations.
Developed a dashboard for real-time analysis across 400+ sites.
✔ Urban Heat Island Detection System (PySpark + Dashboard)
Built a scalable pipeline to analyze temperature and environmental data.
Delivered an interactive dashboard to identify heat hotspots and support planning decisions.
🔹 What you’ll get:
✔ Clear, decision-ready insights
✔ Interactive dashboards
✔ Clean, reliable code
✔ Fast communication and delivery
I don’t just analyze data, I help you understand it and use it to make better decisions.
Steps for completing your project
After purchasing the project, send requirements so Ebingiye Nelvin can start the project.
Delivery time starts when Ebingiye Nelvin receives requirements from you.
Ebingiye Nelvin works on your project following the steps below.
Revisions may occur after the delivery date.
Requirements & Data Intake
Client sends water quality dataset (Excel/CSV), station coordinates, and goals. I review data quality and confirm scope within 24 hours.
Data Cleaning & WQI Calculation
I clean your data, handle missing values, and calculate Water Quality Index using WHO standards. Share initial report for approval.