You will get Python-based data analysis and reports that uncover KPIs and trends
Project details
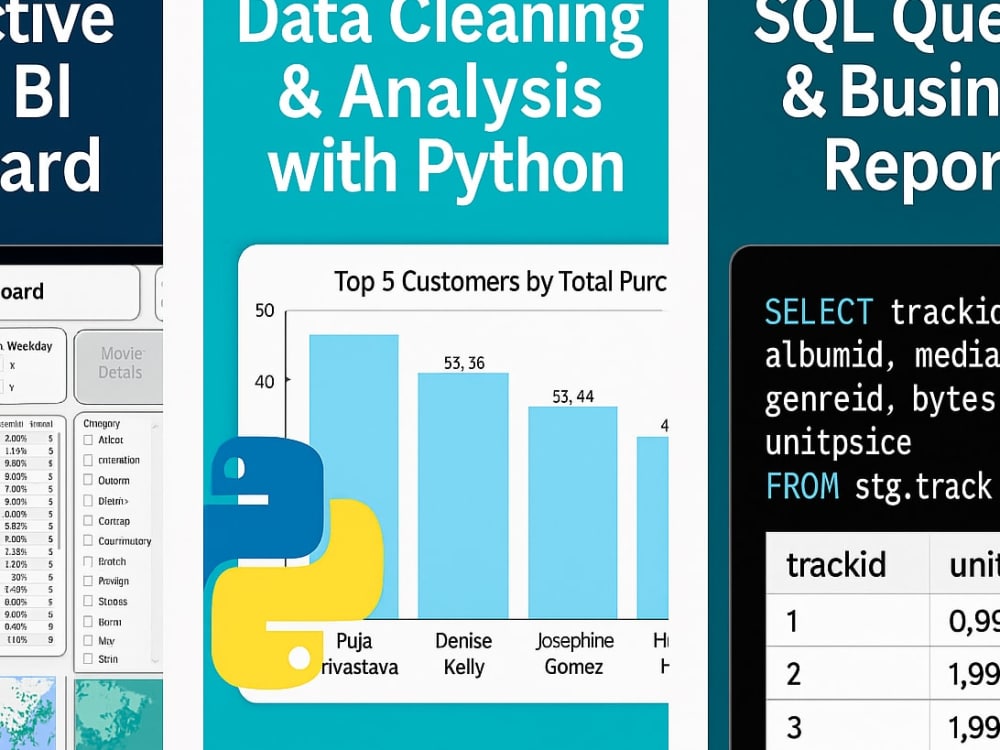
You will get data cleaning, analysis, and visualizations using Python that transform raw information into actionable insights. My project stands out because I combine strong technical expertise (Python, Pandas, NumPy, Matplotlib) with a business-oriented mindset developed through 14 years of operations management.
I specialize in preparing messy Excel, CSV, or database exports into clean structured datasets, then applying Python analysis to generate clear KPIs, trend analysis, and visual reports. Using Pandas and NumPy for processing, and Matplotlib/Seaborn for charts, I ensure the results are accurate, insightful, and visually clear.
You will receive:
A fully documented Python script or Jupyter notebook
A cleaned dataset (Excel/CSV)
Professional charts & visualizations tailored to your goals
A concise PDF or Excel summary report with key findings
What makes this project unique is the balance between technical quality and business clarity. I don’t just produce graphs — I deliver insights that help you make smarter, data-driven decisions.
Data Tool
PythonWhat's included
| Service Tiers |
Starter
$40
|
Standard
$90
|
Advanced
$150
|
|---|---|---|---|
| Delivery Time | 2 days | 4 days | 7 days |
Number of Revisions | 1 | 2 | 3 |
Number of Pages Mined/Scraped | 2 | 8 | 20 |
Number of Sources Mined/Scraped | 1 | 3 | 15 |
Optional add-ons
You can add these on the next page.
Additional Revision
+$20
Additional Page Mined/Scraped
(+ 2 Days)
+$20
Additional Source Mined/Scraped
(+ 2 Days)
+$20Frequently asked questions
About Vladimir
Data Analyst | SQL, Power BI & Python Dashboards
Beersheba, Israel - 8:12 am local time
Recently, I transitioned into Data Analytics, gaining hands-on expertise in SQL, Python, and Power BI through professional training and real-world projects.
✔ Data cleaning & transformation (Excel, CSV, SQL databases)
✔ SQL queries & reporting
✔ Python analysis (Pandas, NumPy, data visualization)
✔ Power BI dashboards & KPI tracking
✔ Business insights & decision support
My goal is to help businesses transform raw data into actionable insights and make smarter, data-driven decisions.
Fluent in English, Hebrew, and Russian — ready to collaborate globally.
Steps for completing your project
After purchasing the project, send requirements so Vladimir can start the project.
Delivery time starts when Vladimir receives requirements from you.
Vladimir works on your project following the steps below.
Revisions may occur after the delivery date.
Review & confirm scope
Check dataset and client goals, confirm deliverables.
Data cleaning
Handle missing values, duplicates, and prepare structured dataset.