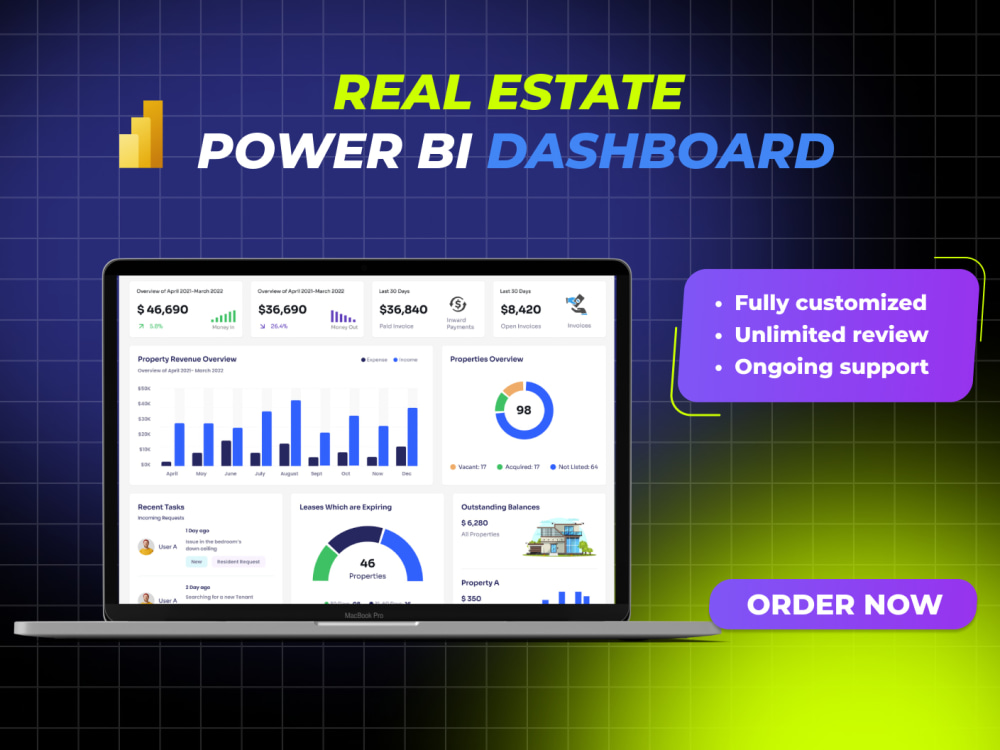
You will get Real Estate Analytics Dashboard in Microsoft Power BI
Top Rated

Project details
Gain deep insights into real estate business operations through monitoring various KPIs and improve overall productivity. Track sales and rental revenue, number of days on market, and more.
Without a business intelligence solution you can depend on, keeping track of so many key metrics can seem like an impossible task. That’s where KPI-BOARD comes in. With a real estate management dashboard, you can view all of your crucial data as it is updated in real-time.
𝐀𝐥𝐥 𝐢𝐧 𝐨𝐧𝐞 𝐩𝐥𝐚𝐜𝐞.
Our system automates data retrieval from diverse sources, ensuring that you are equipped with the most current information. Obtain essential market insights over the relevant time frame.
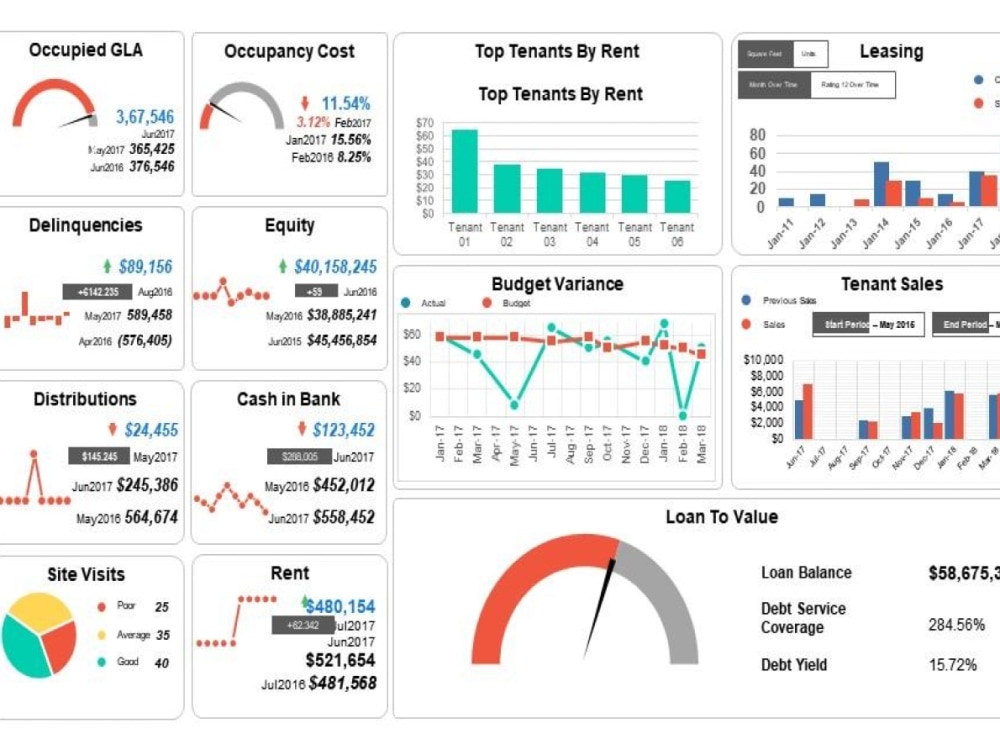
Unlock comprehensive metrics with a single tool, including:
• Occupancy Rate
• Vacancy Loss
• Tenant Analysis (by gender, etc.)
• ROI
• Sales and rental revenue
• Number of properties for sale and rent
• Sales by region
• Number of visits per sale
• Percent difference between asking and selling price
Tailored to meet your unique needs.
Experience not just a standard report, but a fully personalized dashboard crafted exclusively for your requirements.
Curious for more details?
Without a business intelligence solution you can depend on, keeping track of so many key metrics can seem like an impossible task. That’s where KPI-BOARD comes in. With a real estate management dashboard, you can view all of your crucial data as it is updated in real-time.
𝐀𝐥𝐥 𝐢𝐧 𝐨𝐧𝐞 𝐩𝐥𝐚𝐜𝐞.
Our system automates data retrieval from diverse sources, ensuring that you are equipped with the most current information. Obtain essential market insights over the relevant time frame.
Unlock comprehensive metrics with a single tool, including:
• Occupancy Rate
• Vacancy Loss
• Tenant Analysis (by gender, etc.)
• ROI
• Sales and rental revenue
• Number of properties for sale and rent
• Sales by region
• Number of visits per sale
• Percent difference between asking and selling price
Tailored to meet your unique needs.
Experience not just a standard report, but a fully personalized dashboard crafted exclusively for your requirements.
Curious for more details?
Data Tool
Microsoft Power BIWhat's included $50
These options are included with the project scope.
$50
- Delivery Time 7 days
- Number of Revisions Unlimited
- Data Source Connectivity
- Web Embedding
- Interactive/Animated Visuals
Frequently asked questions
14 reviews
(14)
(0)
(0)
(0)
(0)
This project doesn't have any reviews.
MA
Mohammed A.
Apr 22, 2026
Upwork Job Posting — n8n “Deal Radar” for M&A (DA-to-Close) with Alerts
SR
Sher R.
Apr 8, 2025
Power BI Dashboard Development - Further Enhancements
Maksym knows what he is doing and has done an amazing work. He always listens, provides excellent recommendations. Recommended for cooperation when it comes to analytics and dashboards.
MD
Markus D.
Mar 21, 2025
Data Management and Automation
MD
Markus D.
Mar 11, 2025
Automation Consulting and Services
IS
Ivan S.
Nov 22, 2024
Connect MySQL Database from Digital Ocean to Power BI
Perfect job
About Maksym
Marketing Automation | Reports & Dashboards | Data visualisation
100%
Job Success
Kyiv, Ukraine - 3:15 pm local time
I make data understandable, beautiful, and helpful in the decision-making process. My goal is to find interactive and modern solutions that work with your business reporting needs.
Analyzing dry data is a complicated and time-consuming process. A good visualization makes it much simpler and more accessible. Let me help you with that.
🔥 My services:
🟢 Data cleaning: preparation of any type of raw data for further processing.
🟢 ETL Data Pipelines from any data source
🟢 Data source integration incl. API integration
🟢 Data Modelling
🟢 KPIs developing and monitoring
🟢 Data Visualization / Interactive Dashboards / Infographics
🟢 Beautiful looking dashboards and presentations (in Google Data Studio / Looker Studio, PowerBI)
🟢 Business Analysis, i.e., providing actionable insights to solve business problems
🟢 Transition from Google Sheets/Excel reports into automated data dashboards.
🟢 Support for ready-made reports, and Dashboards.
Also, I work and set up from scratch
🟢 Google Analytics 4 (GA4)
🟢 Google Tag Manager (GTM)
🟢 Google Data Studio (GDS)
🟢 Migrations from Universal Analytics to GA4.
🟢 Conversion tracking
🟢 E-commerce set up (Shopify)
🟢 3rd party Integrations
🟢 Paid Traffic Platforms Integrations
🟢 Custom tracking
Over 50+ successful migrations from Universal Analytics to GA4.
My favorite 📈visualization tools are:
🔥Power BI
🔥Google Data Studio
🔥Looker Studio
🔥Google Sheets
⚡Tech stack:
💎Google Big Query
💎 Microsoft Azure
💎 Mongodb & Nosql
💎 SQL, MySQL, PostgreSQL
💎 Python for work with data (Numpy, Pandas)
💎 Google Sheet Functions
💎 Microsoft Excel (Power Query, and Power Pivot)
💎 REST API
💎 Shopify
💎 Google Analytics 4
🥋 How it works:
1️⃣ We learn tasks and perform complete data audits.
2️⃣ Define goals and metrics for the step of work.
3️⃣ Find data sources and prepare data modeling
4️⃣ Carefully select and segment the information received.
5️⃣ We provide comprehensive and clear reports, and data visualization and give recommendations.
Data sources:
🟢Google Analytics
🟢Google/Facebook/Instagram/Microsoft Ads
🟢Youtube
🟢Shopify, Amazon, eBay
🟢Salesforce
🟢Quickbooks
🟢Creatio
🟢Shopify
🟢Any data you have...
I do my best to deliver quality work as quickly as possible. Always try to suggest the most effective ways of tracking and resolving data analytics tasks.
🤙 Hit me up, and we can always jump on a quick call. I will be very pleased to discuss your project or Business Needs!
✅ Click the "Invite" button on the top right of this page to start our cooperation.
=============================
🔑 Keywords: Business Intelligence, Data Visualization, Interactive Dashboards, Reports & Dashboards, Data Modeling, KPI Development, ETL Pipelines, Power BI Development, Google Data Studio Dashboards, Looker Studio Reports, Data Analysis, Marketing Analytics, Predictive Analytics, Financial Analytics, API Integration, Data Cleaning, SQL Queries, Data Pipelines, BigQuery Integration, Shopify Analytics, Lead Generation, Google Analytics 4 Migration, Conversion Tracking, Paid Traffic Platforms Integration, Custom Tracking (GTM), Marketing Funnel Optimization, Power BI, Tableau, Looker Studio, Microsoft Azure, Google Analytics, SQL Server Reporting Services, Python (Pandas, Numpy), REST API Integration, Zapier, Make.com (Integromat), N8N, ClickUp, Asana, Monday.com, Trello, Notion, HubSpot, Pipedrive, Zoho CRM, Airtable, ActiveCampaign, MailChimp, Klaviyo, SendGrid, Typeform, Jotform, Google Forms, Formsite, Gravity Forms, QuickBooks, Xero, Stripe, PandaDoc, Skedda, Acuity Scheduling, Calendly, ScheduleOnce, EverWebinar, Google Apps Script, Open AI, ManyChat, Facebook Ads, Facebook API, Chirply, Shopify, Wix, ClickFunnels, LeadPages, E-commerce Analytics, Social Media Analytics, Financial Reporting, Retail Insights, SaaS Metrics Dashboards, Operational Analytics, Survey Data Analysis, Digital Marketing Campaign Analysis, Automated Reports, KPI Dashboards, Infographics, Data-Driven Presentations, Customized ETL Processes, A/B Testing, Customer Segmentation, Sales Dashboards, E-commerce Sales Analytics, Financial Health Dashboards, Retail Inventory Management Dashboards, Customer Loyalty Program Dashboards, RFM Customer Base Analysis, Logistics Performance Dashboards, Production Cycle Analysis, , Shopify Integrations, WooCommerce Integrations, Payment Processing Optimization, Inventory Management, Customer Journey Analytics, Cross-Platform Integration, Google Tag Manager Setup, Advanced Excel (Power Query, Power Pivot), Salesforce CRM, Xero Integration, Snowflake Data Warehousing, Slack Integrations, Chatbots, Customer Retention Strategies, Marketing Funnels, Financial Reporting Optimization.
Steps for completing your project
After purchasing the project, send requirements so Maksym can start the project.
Delivery time starts when Maksym receives requirements from you.
Maksym works on your project following the steps below.
Revisions may occur after the delivery date.
Max works on your project following the steps below.
Revisions may occur after the delivery date.