You will get Economic Accessibility Index Modeling & Interactive WebGIS Dashboard
Project details
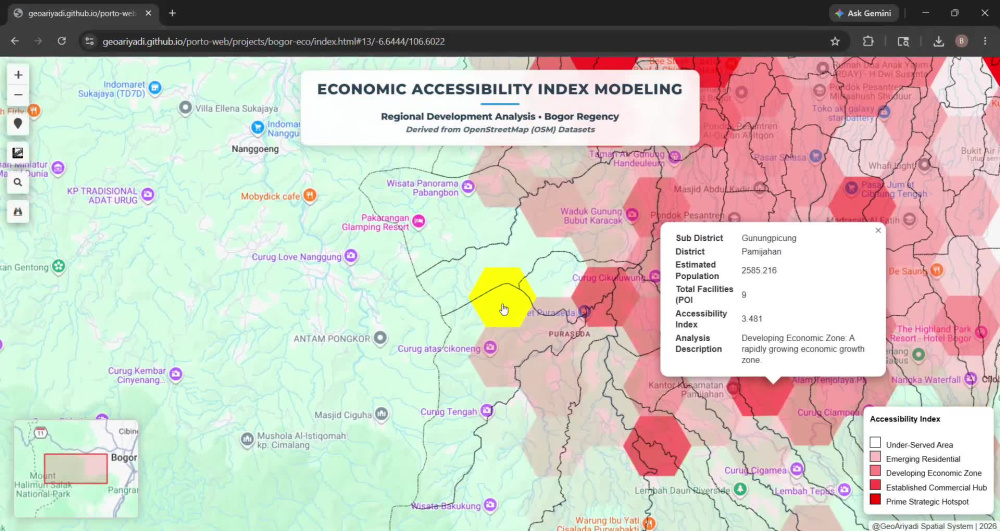
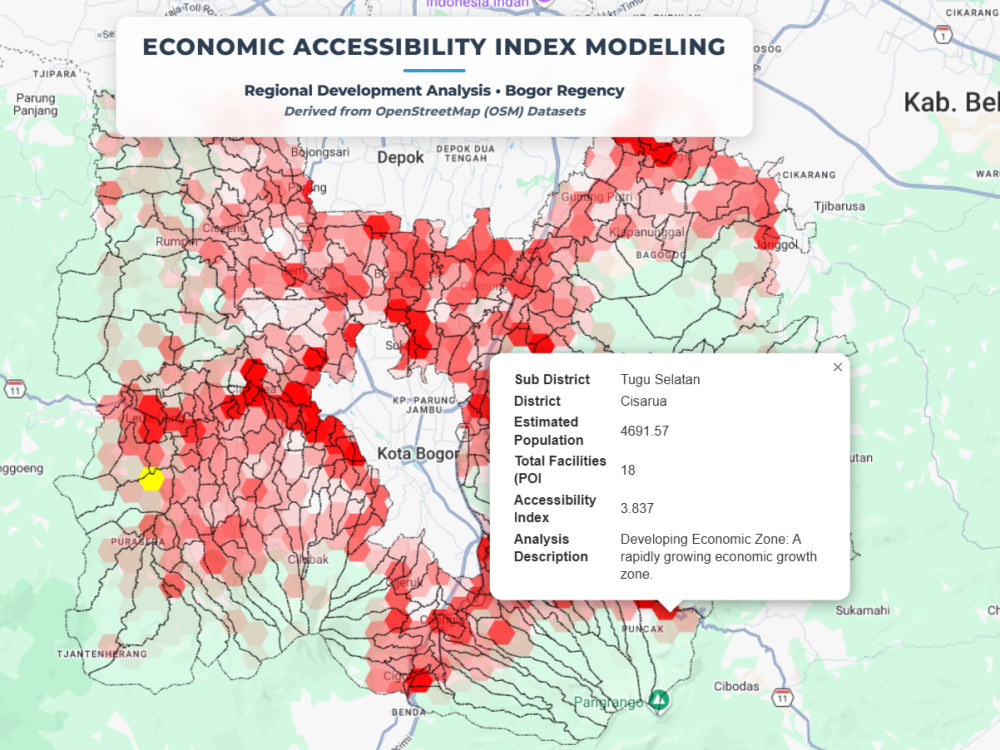
This project demonstrates a custom spatial analysis and interactive WebGIS dashboard designed to evaluate economic accessibility across Bogor Regency.
The goal was to identify areas with varying levels of access to economic opportunities by combining population distribution and business activity into a single spatial intelligence framework.
Using geospatial analysis and interactive mapping, the dashboard helps users quickly explore:
Areas with strong economic accessibility
Neighborhoods with limited access to services or commercial activity
Spatial patterns that support planning and investment decisions
Comparative accessibility across regions through an intuitive map interface
The final output is a web-based interactive dashboard that transforms complex geographic data into clear, actionable insights for urban analysis, planning, and decision-making.
Project highlights
Custom spatial index modeling
Multi-source geospatial data integration
Interactive WebGIS dashboard
Dynamic map exploration and visualization
Scalable framework for location intelligence applications
Tools used
QGIS, PostgreSQL/PostGIS, GeoServer, Leaflet.js, and modern web deployment tools.
Programming Languages
HTML & CSS, JavaScript, JavaWhat's included
| Service Tiers |
Starter
$149
|
Standard
$349
|
Advanced
$749
|
|---|---|---|---|
| Delivery Time | 3 days | 7 days | 14 days |
Number of Revisions | 1 | 3 | 3 |
Number of Pages | 1 | 2 | 4 |
Design Customization | |||
Content Upload | - | ||
Responsive Design | |||
Source Code |
Frequently asked questions
About Bayu
GIS & Remote Sensing Analyst | WebGIS Developer | Spatial Data Analyst
Bogor, Indonesia - 12:52 am local time
I help businesses and organizations transform complex spatial data into accurate, production-ready maps, dynamic dashboards, and live WebGIS solutions.
My expertise covers end-to-end geospatial workflows, specializing in processing large datasets, automated spatial databases, and deploying clean web map applications that deliver clear analysis results.
Core Skills:
• GIS Analysis & High-Scale Spatial Data Processing
• WebGIS Architecture & Dashboard Development
• Remote Sensing & Automated Raster Analysis
• Spatial Database Management (PostGIS / PostgreSQL)
• Georeferencing, Digitizing & Topology Cleaning
• Drone Photogrammetry & Orthomosaic 3D Mapping
• Advanced Cartography & National Standard Mapping
I focus on building reliable, clean, and practical geospatial solutions—from raw data preparation to fully deployed web map applications. If you need clean spatial data, advanced mapping, or a custom WebGIS setup, I’m ready to deploy it for you.
Tools & Technologies:
QGIS | ArcGIS | PostGIS | PostgreSQL | Leaflet | JavaScript | GeoJSON | ERDAS Imagine | ENVI | Global Mapper | Visual Studio
Steps for completing your project
After purchasing the project, send requirements so Bayu can start the project.
Delivery time starts when Bayu receives requirements from you.
Bayu works on your project following the steps below.
Revisions may occur after the delivery date.
Data Audit & Conceptual Design
I will review your datasets (SHP, CSV, etc.) and requirements. We’ll finalize the analysis parameters and map styling to ensure the technical setup aligns perfectly with your project goals.
Spatial Analysis & Processing
Core geoprocessing begins. Using QGIS/PostGIS, I’ll perform the necessary spatial modeling (e.g., accessibility, 3D processing, or zonal stats) to generate the analytical layers for your map.