You will get Sales Analysis Dashboard in Microsoft Power BI.
Project details
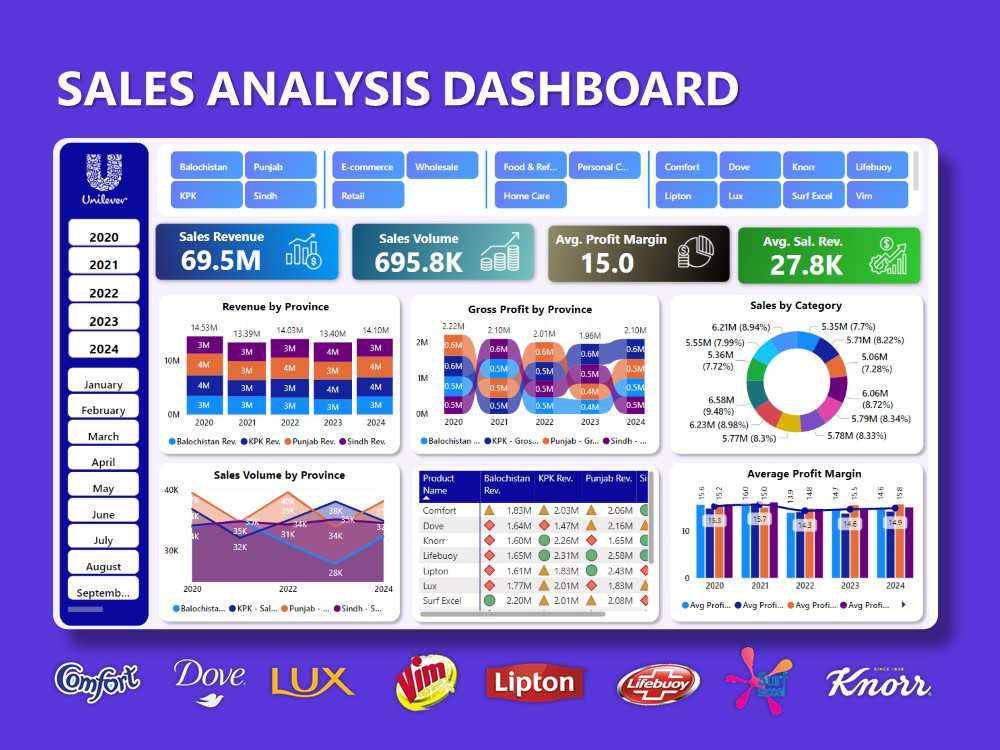
Empower your business with a dynamic Power BI dashboard that provides a comprehensive view of your sales performance. This interactive tool goes beyond basic reporting, offering deep insights into critical sales metrics and uncovering hidden opportunities for growth.
Key Features:
Track Core Sales Metrics:
• Sales Revenue: Monitor overall revenue trends, identify key revenue drivers, and track progress towards sales targets.
• Sales Volume: Analyze sales volume trends, identify top-selling products, and understand customer purchasing behavior.
• Average Profit Margin: Gain insights into profitability at the product and customer level, and identify areas for improvement.
Visualize Sales Performance:
• Revenue by State: Analyze regional sales performance, identify high-growth markets, and tailor your sales strategies accordingly.
• Sales by Category: Understand the performance of different product categories, identify top-selling categories, and optimize your product mix.
• Sales by Product: Analyze individual product performance, identify best-sellers, and uncover opportunities for product innovation and pricing optimization.
Data Tool
Microsoft Power BIWhat's included $50
These options are included with the project scope.
$50
- Delivery Time 5 days
- Number of Revisions 3
- Number of Graphs/Charts 6
- Number of Variations 3
- Data Source Connectivity
- Interactive/Animated Visuals
About Shujaat
Dashboard & Presentation Design Expert | Power BI & Excel Specialist
Karachi, Pakistan - 1:12 pm local time
Whether you're a startup needing a compelling investor deck, a business requiring insightful dashboards, or a team in search of visually stunning presentations, I ensure every project is tailored, professional, and impactful.
What I Offer:
• Power BI Dashboards: Interactive and dynamic visualizations with actionable insights.
• Excel Dashboards: Advanced, automated dashboards with KPIs and metrics.
• Pitch Decks: Investor-ready designs that captivate and convert.
• PowerPoint & Google Slides Presentations: Polished and persuasive for any purpose—business, education, or corporate.
• Canva Presentations: Creative and visually engaging solutions for diverse needs.
Why Choose Me?
• Tailored Solutions: I customize every project to suit your business needs.
• Data-Driven Insights: I combine creativity with analytics to tell a compelling story through data.
• Attention to Detail: Perfection is my standard—expect error-free, aesthetically pleasing work.
• Client-Centric Approach: I prioritize communication, deadlines, and client satisfaction.
Key Skills & Tools:
• Microsoft Power BI: DAX, Measures, Interactive Dashboards, Data Modeling
• Microsoft Excel: Pivot Tables, Power Query, Advanced Formulas, Conditional Formatting
• Design Tools: Canva, Adobe Photoshop (basic for visuals)
• Presentation Skills: Storyboarding, Visual Hierarchy, Branding Consistency
Industries I’ve Worked With:
• Startups & Entrepreneurs: Investor pitch decks, biotech pitch decks & financial insights.
• E-commerce: Sales analysis & marketing dashboards.
• Corporate: Business intelligence tools & executive reports.
• Education: Learning materials and academic presentations.
Let’s Collaborate to Elevate Your Business!
Send me a message today, and let’s discuss how I can transform your data and ideas into engaging dashboards and presentations that deliver results!
Steps for completing your project
After purchasing the project, send requirements so Shujaat can start the project.
Delivery time starts when Shujaat receives requirements from you.
Shujaat works on your project following the steps below.
Revisions may occur after the delivery date.
Requirement Gathering
I’ll start by understanding your goals, KPIs, and preferences. I’ll also collect and review your raw data to ensure it aligns with the dashboard objectives.
Dashboard Development
I’ll clean and prepare your data, then design and develop a dynamic Power BI dashboard with interactive visuals and filters tailored to your needs.