You will get Scalable Retail SQL Database and Interactive Power BI Dashboards
Project details
Turn your raw retail data into a high-performance decision engine.
Most retail businesses struggle with "Data Silos"—where sales, inventory, and staff information are disconnected. I specialize in breaking those silos. As an AI Engineering student and experienced Data Analyst, I don’t just build dashboards; I design scalable database architectures that are ready for the future of automation.
What sets this project apart:
Engineering-First Approach: I use SQL best practices (Normalization, Constraints, and Indexing) to ensure your data is accurate and fast.
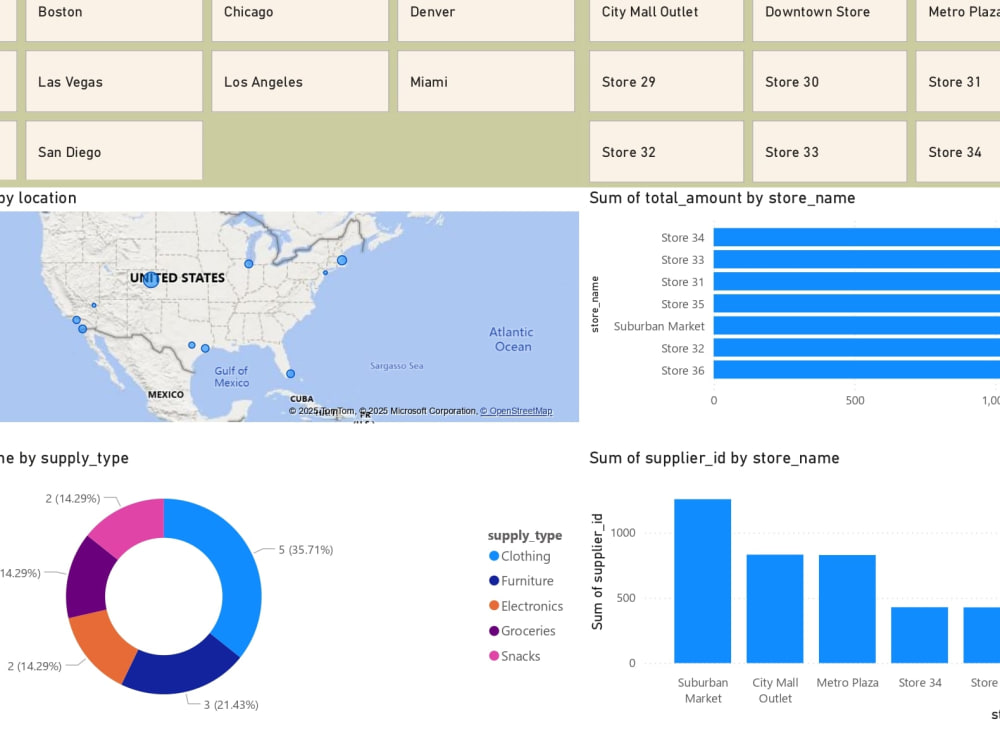
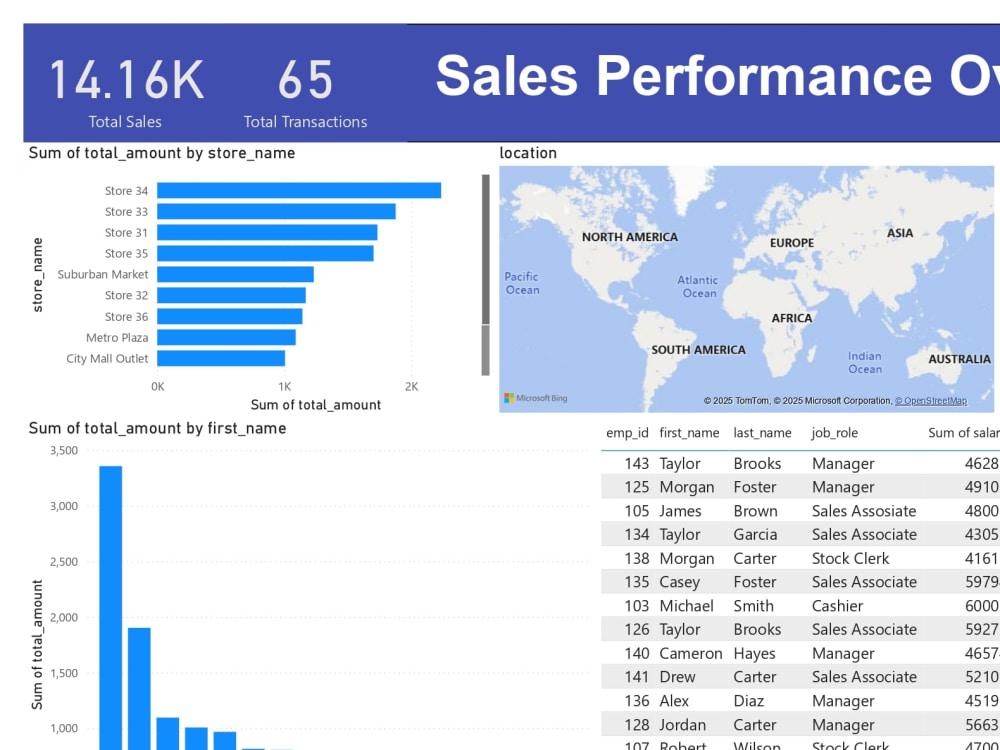
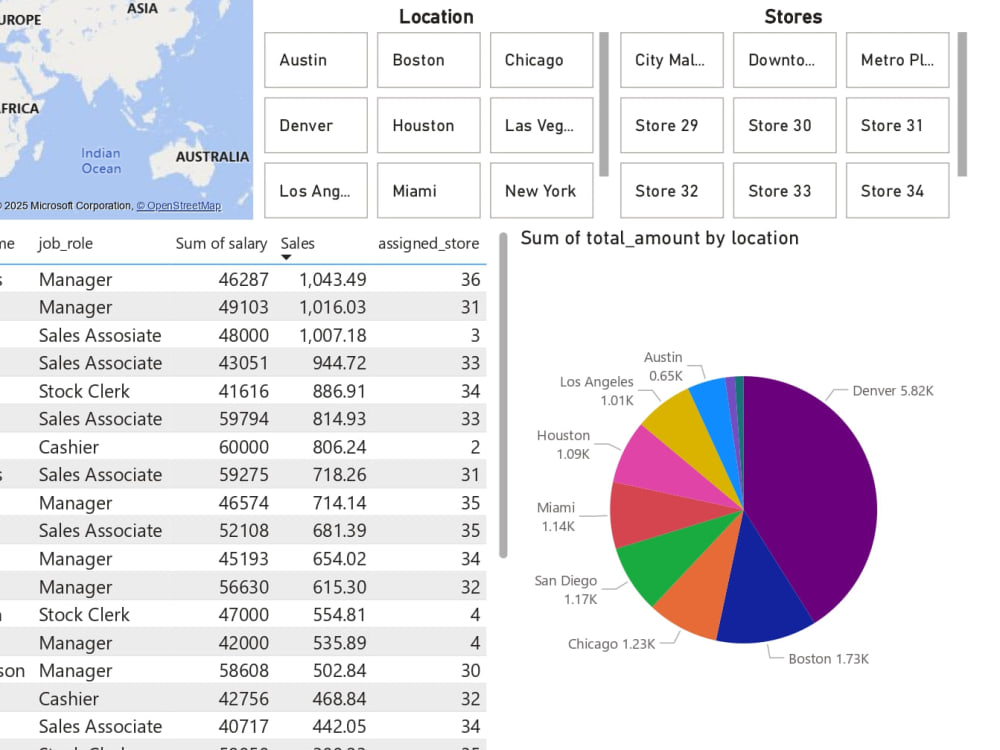
Narrative Visualization: Using Power BI, I transform rows of data into a visual story that highlights your most profitable regions and top-performing assets.
AI-Ready Structure: My database designs are built to support future AI integration, such as sales forecasting and customer churn analysis.
Whether you are a small store owner or a growing regional chain, I provide the technical backbone you need to stop guessing and start growing.
Most retail businesses struggle with "Data Silos"—where sales, inventory, and staff information are disconnected. I specialize in breaking those silos. As an AI Engineering student and experienced Data Analyst, I don’t just build dashboards; I design scalable database architectures that are ready for the future of automation.
What sets this project apart:
Engineering-First Approach: I use SQL best practices (Normalization, Constraints, and Indexing) to ensure your data is accurate and fast.
Narrative Visualization: Using Power BI, I transform rows of data into a visual story that highlights your most profitable regions and top-performing assets.
AI-Ready Structure: My database designs are built to support future AI integration, such as sales forecasting and customer churn analysis.
Whether you are a small store owner or a growing regional chain, I provide the technical backbone you need to stop guessing and start growing.
Data Tool
SQLWhat's included
| Service Tiers |
Starter
$50
|
Standard
$100
|
Advanced
$150
|
|---|---|---|---|
| Delivery Time | 2 days | 4 days | 7 days |
Number of Revisions | 1 | 2 | 3 |
Number of Graphs/Charts | 0 | 6 | 12 |
Number of Variations | 1 | 1 | 0 |
Data Source Connectivity | - | ||
Web Embedding | - | - | |
Interactive/Animated Visuals | - |
Optional add-ons
You can add these on the next page.
Fast Delivery
+$15 - $25
Additional Revision
+$25
Additional Variation
(+ 2 Days)
+$30Frequently asked questions
About Syed Izhan
Data Analyst / Excel, Python, SQL, and power BI specialist
Hyderabad, Pakistan - 11:09 pm local time
With a solid foundation from coursework by IBM, Google, and Stanford on Coursera, I possess in-depth knowledge in data manipulation, statistical analysis, and visualization techniques. Currently pursuing a high school education in Engineering, I continuously expand my skill set to stay ahead in data analytics.
My hands-on experience includes data collection, manipulation, and exploratory analysis. I thrive on tackling challenging projects and delivering innovative solutions. Quick to grasp core issues, my patience and dedication ensure consistent, high-quality results.
Whether optimizing workflows, identifying trends, or uncovering insights, I collaborate to drive impactful outcomes. Let's connect and explore how data can help achieve your business objectives.
Steps for completing your project
After purchasing the project, send requirements so Syed Izhan can start the project.
Delivery time starts when Syed Izhan receives requirements from you.
Syed Izhan works on your project following the steps below.
Revisions may occur after the delivery date.
Discovery & Data Audit
I review your existing files (Excel/SQL) and business goals to define the key metrics that matter most to your retail success.
Database Schema & ERD Design
I design the "Blueprint" (Entity Relationship Diagram) to ensure your stores, employees, and products are logically connected for 100% data integrity.