You will get Streamlit dashboard code that runs locally and turns data into insights

Project details
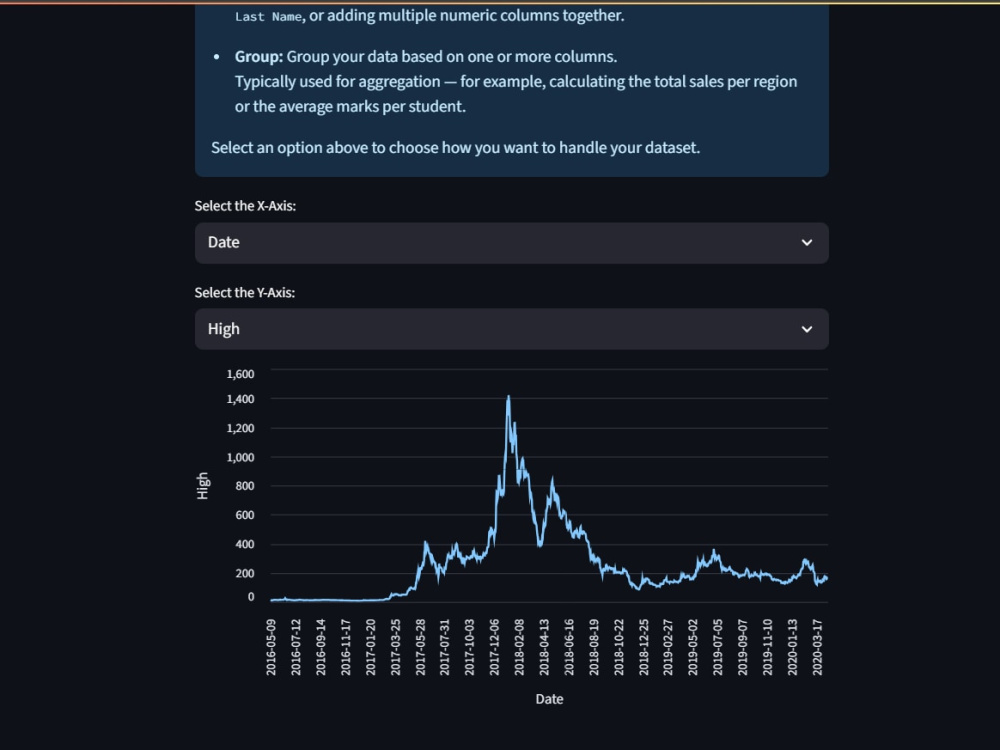
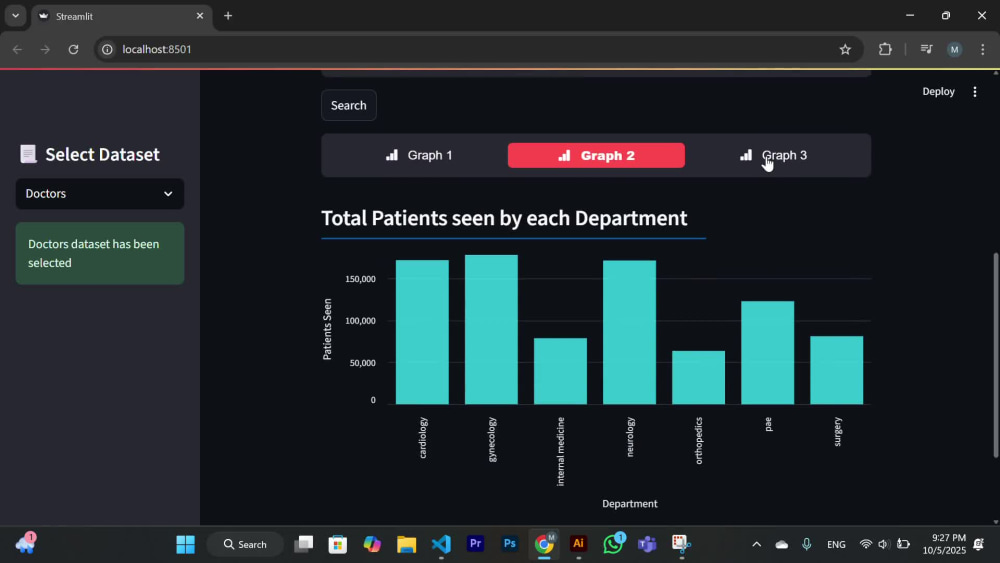
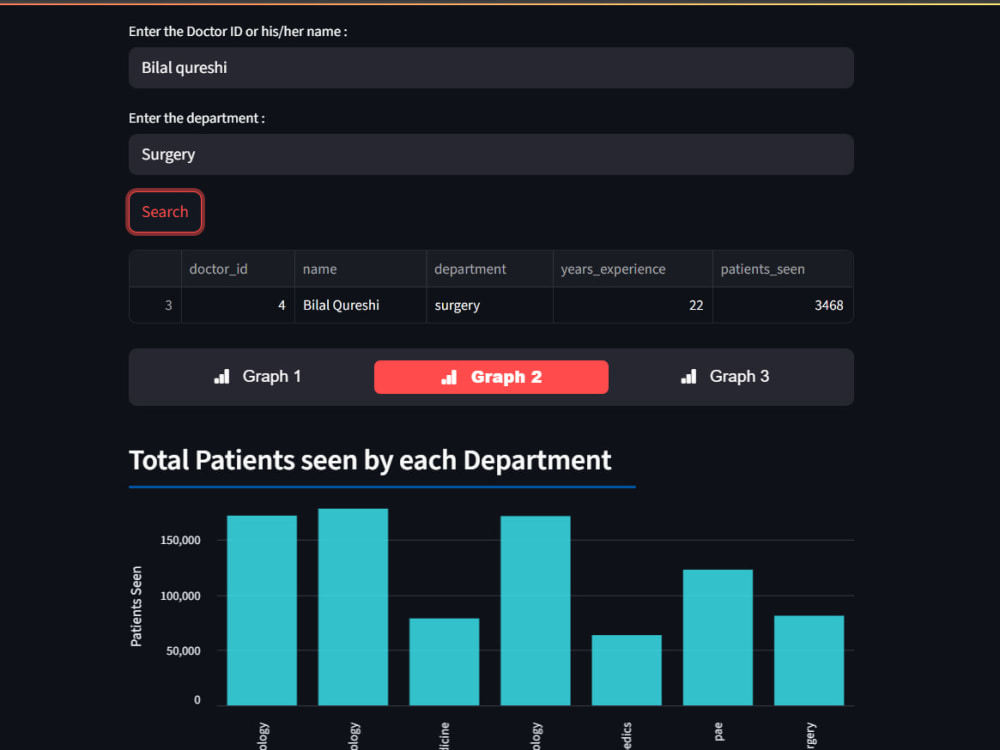
I deliver clean, well-structured Streamlit dashboard code built for analytics and real impact. My dashboards include KPIs and interactive charts, designed to run locally with your data, allowing you to explore insights instantly without complex setup. Fast delivery, modular code, and bug-free results set my work apart.
Programming Languages
PythonWhat's included
| Service Tiers |
Starter
$25
|
Standard
$50
|
Advanced
$80
|
|---|---|---|---|
| Delivery Time | 4 days | 7 days | 10 days |
Number of Revisions | 1 | 2 | 3 |
Number of Pages | 1 | 1 | 1 |
Design Customization | - | - | |
Content Upload | - | - | - |
Responsive Design | - | ||
Source Code |
Optional add-ons
You can add these on the next page.
Additional Revision
+$10
Additional Page
(+ 3 Days)
+$10About Muhammad Hammad
Data Analysis & Testing | C++, Exploratory Data Analysis, Analytics
Islamabad, Pakistan - 7:19 am local time
and insight generation. Skilled in building interactive Streamlit dashboards and creating clear, informative
visualizations using Matplotlib and Seaborn. Possess a strong understanding of data analytics concepts, including
exploratory data analysis and trend identification. Also proficient in C++ as an additional programming skill, with
a solid foundation in problem-solving and logical thinking.
Steps for completing your project
After purchasing the project, send requirements so Muhammad Hammad can start the project.
Delivery time starts when Muhammad Hammad receives requirements from you.
Muhammad Hammad works on your project following the steps below.
Revisions may occur after the delivery date.
Collect & Review Data
Analyze datasets and confirm KPIs and chart needs.
Build Dashboard Code
Develop clean, modular Streamlit code with visuals and interactivity.