You will get time series forecasting using R, Python, Excel, and EViews
Top Rated
Project details
I provide professional time series data analysis and forecasting for business, industrial, and research projects using R, Python, Excel, and EViews. My expertise includes statistical, ML, and deep learning models for accurate forecasting and decision-making.
Services include:
• Application of ARIMA, SARIMA, ARIMAX, VAR, VECM, ARCH, GARCH, and Exponential Smoothing (Holt-Winters).
• ML models such as XGBoost, CatBoost etc.
• Deep learning models; LSTM, Bidirectional LSTM, GRU, CNN-LSTM, and hybrid CNN-RNN frameworks for non-linear data.
• Data preparation, stationarity testing (ADF, KPSS), differencing, detrending, and decomposition to address trend and seasonality.
• Model selection using ACF/PACF and Box-Jenkins methodology.
• Performance evaluation with AIC, BIC, RMSE, and MAE metrics for model validation.
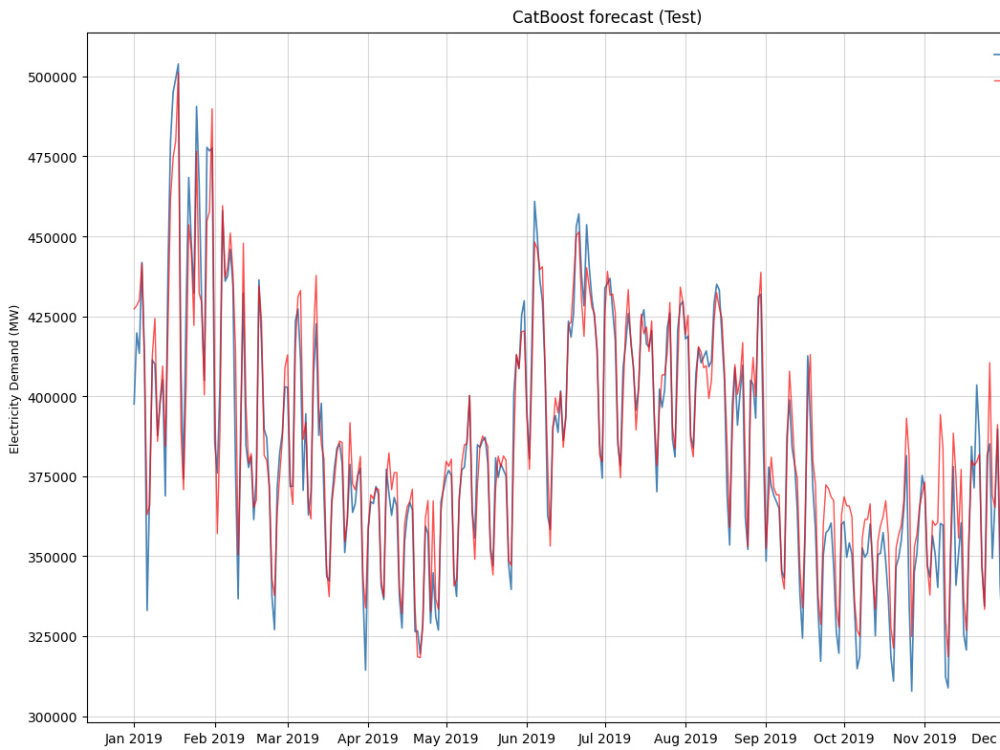
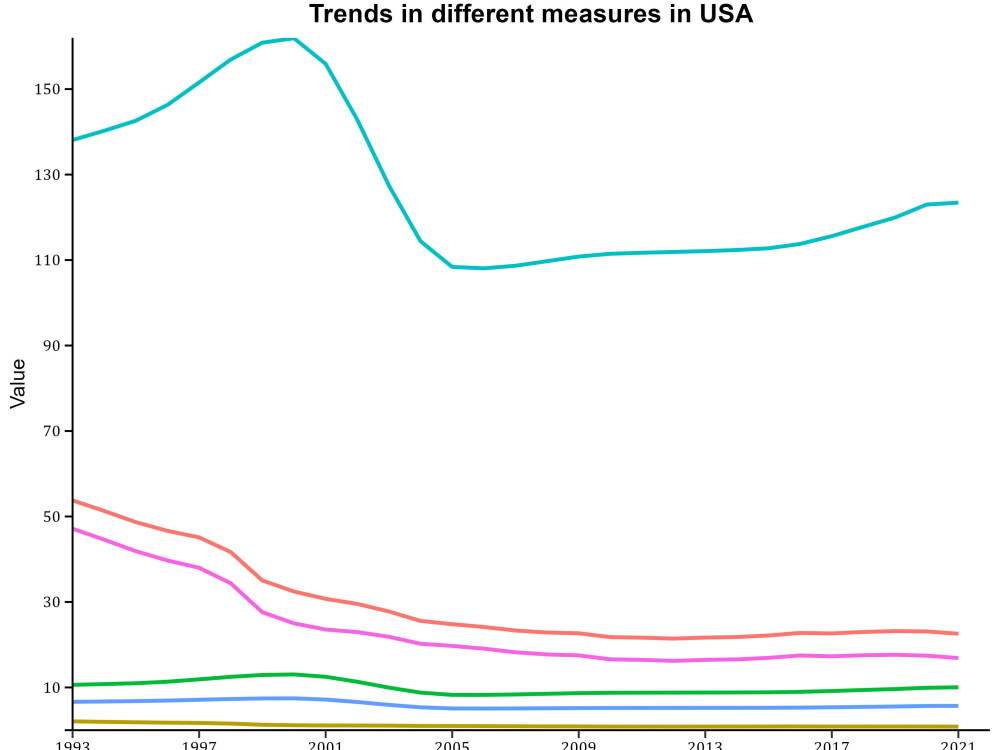
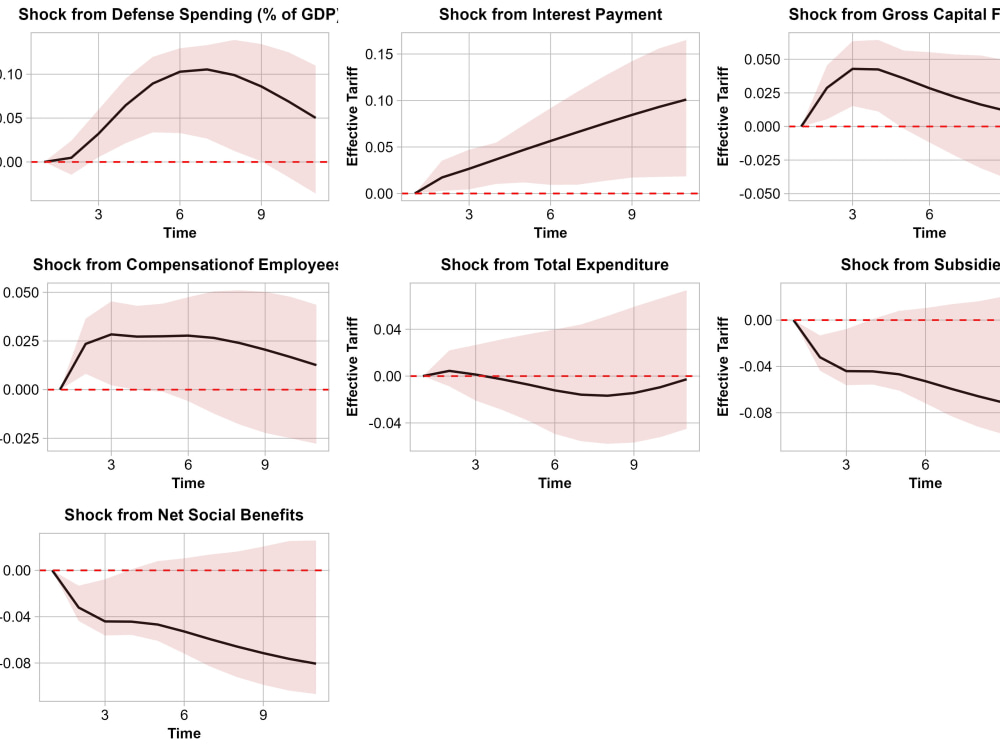
• Visualization of forecasts, residual diagnostics, and comparison plots for interpretation.
I can assist with sales forecasting, demand estimation, financial prediction, or production planning—providing reliable, well-documented, and business-focused results.
Services include:
• Application of ARIMA, SARIMA, ARIMAX, VAR, VECM, ARCH, GARCH, and Exponential Smoothing (Holt-Winters).
• ML models such as XGBoost, CatBoost etc.
• Deep learning models; LSTM, Bidirectional LSTM, GRU, CNN-LSTM, and hybrid CNN-RNN frameworks for non-linear data.
• Data preparation, stationarity testing (ADF, KPSS), differencing, detrending, and decomposition to address trend and seasonality.
• Model selection using ACF/PACF and Box-Jenkins methodology.
• Performance evaluation with AIC, BIC, RMSE, and MAE metrics for model validation.
• Visualization of forecasts, residual diagnostics, and comparison plots for interpretation.
I can assist with sales forecasting, demand estimation, financial prediction, or production planning—providing reliable, well-documented, and business-focused results.
Data Tool
RWhat's included
| Service Tiers |
Starter
$50
|
Standard
$100
|
Advanced
$150
|
|---|---|---|---|
| Delivery Time | 3 days | 4 days | 5 days |
Number of Revisions | 1 | 1 | 1 |
Number of Graphs/Charts | 3 | 3 | 3 |
Number of Scenarios | 1 | 1 | 1 |
Number of Model Variations | 1 | 1 | 1 |
Model Documentation | |||
Data Source Connectivity | |||
Model Validation/Testing |
Optional add-ons
You can add these on the next page.
Fast Delivery
+$30
Additional Revision
+$20
Additional Graph/Chart
(+ 1 Day)
+$10
Additional Scenario
(+ 1 Day)
+$20
Additional Model Variation
(+ 1 Day)
+$20
28 reviews
(28)
(0)
(0)
(0)
(0)
This project doesn't have any reviews.
JM
Joseph M.
Jan 11, 2026
Advanced Algorithms Tutoring
Yursa is extremely smart and helpful - I would highly recommend!
TH
Toto H.
Jan 8, 2026
tutoring for SPSS Statistics.
Thank you for helping me with SPSS.
JM
Joseph M.
Aug 24, 2025
Natural Language Processing
Yursa is excellent to work with!
JM
Joseph M.
May 15, 2025
ML Tutoring and Advanced Analytics
Yursa was amazing to work with!
DZ
Dr. Rizwan Z.
Feb 17, 2025
Statistical Analysis of a Cross-sectional Mental Health-Related Study
About Yusra
Statistician and Data Analyst
100%
Job Success
Lahore, Pakistan - 3:40 pm local time
My expertise includes statistical programming, data analysis, exploratory and confirmatory analysis, feature selection, probabilistic techniques, sampling design, statistical estimation, and experimental design. I specialize in both time series and spatial modeling, with a lot of experience in regression techniques, including linear, non-linear, mixed-effect, and econometric models. I am proficient in general and generalized linear models, generalized additive models (GAMs), and Bayesian hierarchical and spatial models with various priors.
Alongside statistical modeling, I can assist with machine learning and deep learning methods such as LSTM, CNN, and Transformer architectures for forecasting and image classification projects. I can also perform SQL-based data handling and use Visual Studio Code for analytical scripting and workflow automation.
Beyond analysis, I create interactive dashboards and reports in Power BI and Tableau to track and visualize key performance indicators. For data analysis summaries, theoretical explanations, or statistical reports, I provide well-structured documentation in Overleaf, LaTeX, Word, and Markdown according to project requirements. I conduct my work using RStudio, Python, SPSS, Jamovi, Minitab, JASP, WEKA, and Excel/Google Sheets.
Steps for completing your project
After purchasing the project, send requirements so Yusra can start the project.
Delivery time starts when Yusra receives requirements from you.
Yusra works on your project following the steps below.
Revisions may occur after the delivery date.
Data preparation and exploration
The initial step will be cleaning and preparing data; missing values estimation, outliers, & transformations. Then exploring series via visualizations, stationarity checks, identifying seasonality or trends, ACF & PACF, etc.
Model selection and implementation
I'll select suitable models based on data trends. This may include models such as ARIMA, SARIMA, ETS, VAR, GARCH, etc. The model will be evaluated using AIC, BIC, etc. Other than statistical models, deep learning models like LSTM for forecasting.