You will get sales analytics in excel and google spreadsheet
Project details
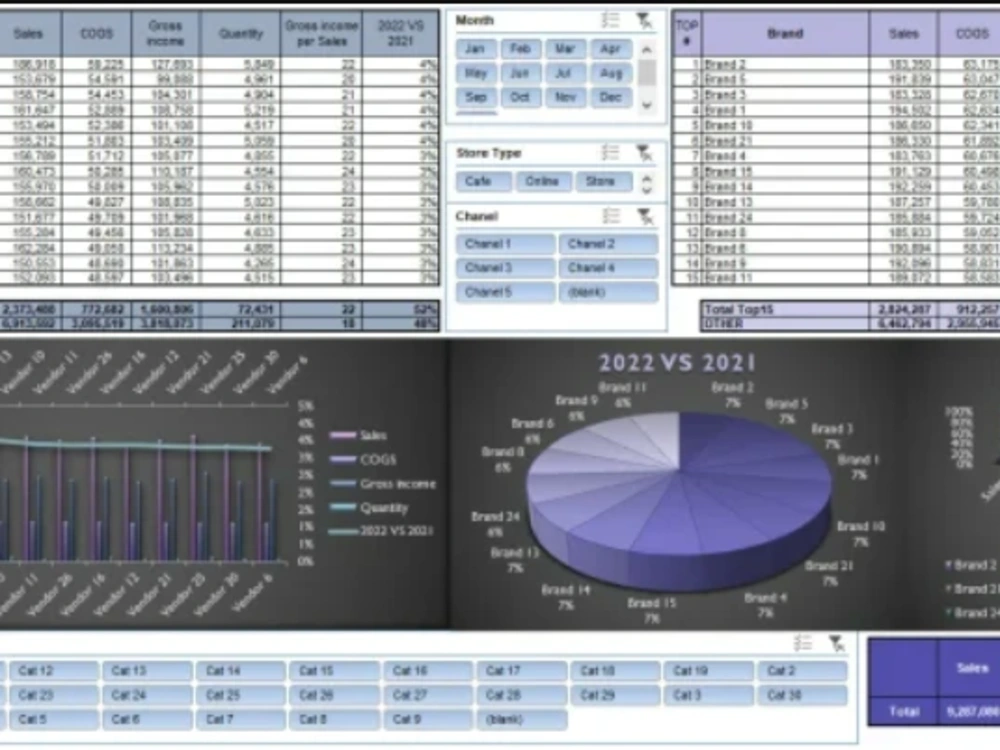
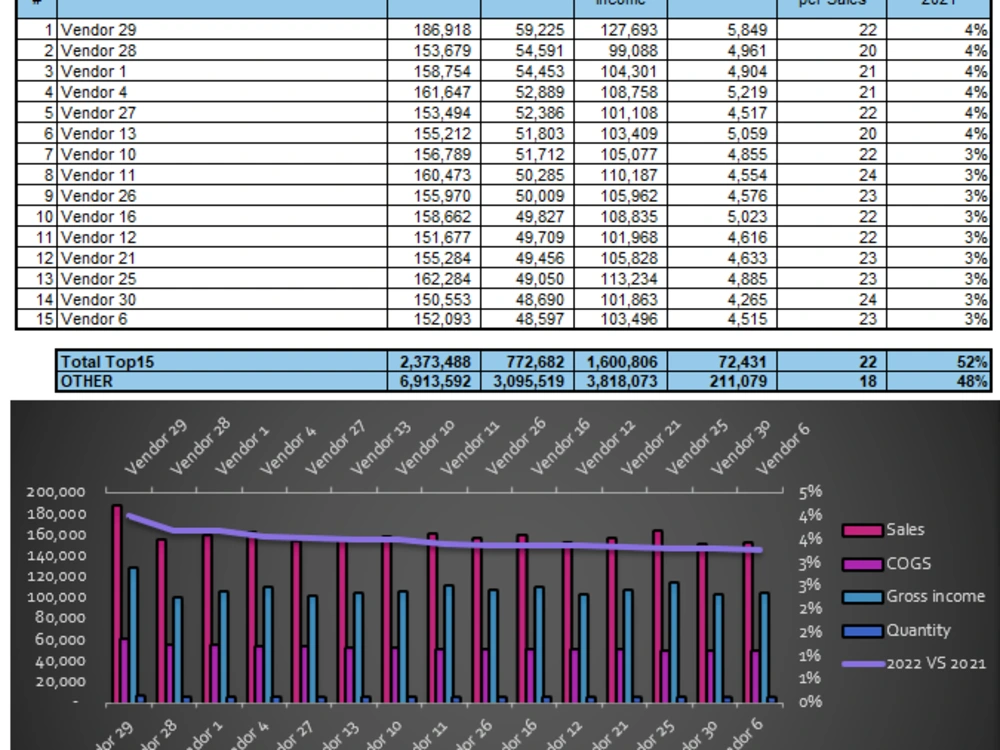
This Report will give you everything you need about your sales and trends.
With using Slicers you can easily see what happened in past years and what should be the next step.
Report gives you top 15 sales Brands, Vendors, Stores in past 2 years, form where you can easily see your growth rate, most profitable products and locations.
It gives you Quantity of Sales.
Report is automated so if you add more data it will automatically refresh.
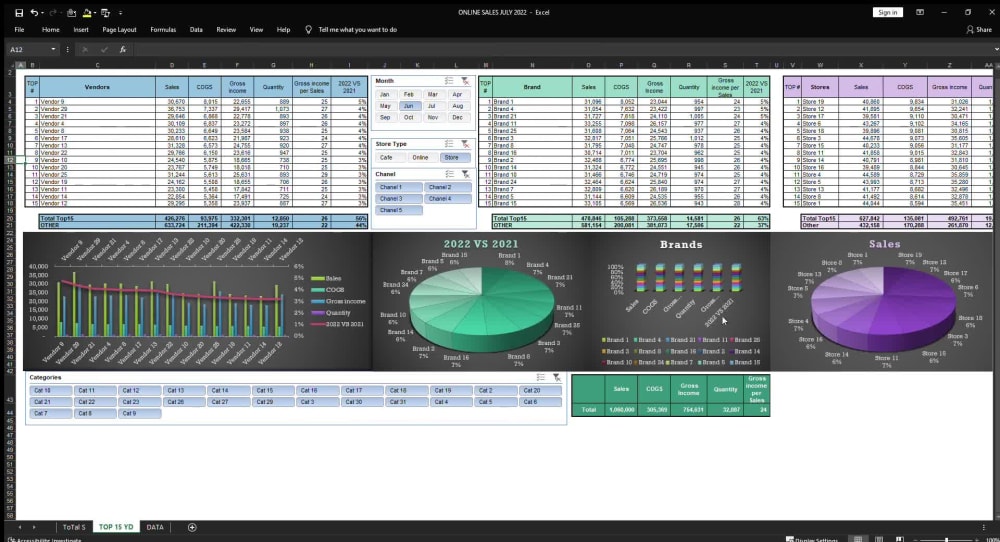
Data Tool
Microsoft ExcelWhat's included $100
These options are included with the project scope.
$100
- Delivery Time 5 days
- Number of Revisions 2
Optional add-ons
You can add these on the next page.
Fast 2 Days Delivery
+$20
Additional Revision
+$10Frequently asked questions
About Nana
Data Analyst
Tbilisi, Georgia - 1:07 am local time
Hey, I'm Nana and Welcome to my profile.
💡 What I Bring to the Table
📈 Power BI Expert (3+ years) — building interactive dashboards, DAX-driven measures, and dynamic reports that help clients instantly see what matters most.
🧩 SQL Proficiency — writing complex queries, optimizing joins, and transforming large datasets into clean, analytics-ready models.
📊 Excel Mastery (6+ years) — advanced formulas, automation, Power Query, and Data Model integration for consistent reporting.
⚙️ ETL & Data Modeling — combining multiple data sources (Excel, SQL Server, Google Sheets, APIs) into one reliable reporting system.
🔍 Business Insight Builder — transforming raw numbers into KPIs that actually explain “why” performance changes.
💬 Clear communicator — I translate complex data findings into visuals and words that every stakeholder understands.
🏆 Highlights & Accomplishments
Designed multi-layer Power BI dashboards with slicers, dynamic metrics, and currency switchers for eCommerce sales analysis.
Built SQL-based data pipelines for sales and finance teams to automate weekly and monthly reporting.
Created customer behavior models using Power BI + SQL to identify repeat buyers and improve retention.
Developed financial forecasting tools integrating COGS, revenue, and shipping data to support strategy decisions.
Supported retail and online brands with insights that boosted marketing ROI and improved operational visibility.
🎓 Education & Certifications
🎓 Master’s in Data Science
🎓 Bachelor’s in Finance
📜 Certified Power BI Professional
⚡ Why Clients Love Working With Me
I think like an analyst and build like an engineer.
I anticipate your data needs and deliver dashboards that save hours every week.
My reports aren’t just visuals — they’re decision tools that simplify complexity.
Fast, organized, and always responsive — I make data collaboration effortless.
Steps for completing your project
After purchasing the project, send requirements so Nana can start the project.
Delivery time starts when Nana receives requirements from you.
Nana works on your project following the steps below.
Revisions may occur after the delivery date.
Undarstanding what you need and what can be done
Sharing the data. giving me the requirements, I will tell you what will be possible to be done, also I have lot's of experience in sales so I can give you some advice what kind of report will be more useful for you.
Working on Project
I will start working on the project. I will be using some questions to make the dashboard more useful and easy to use for the customer. I will be sharing some screenshots and how the project is going.